A naukri.com initiative
Dev
5d
217
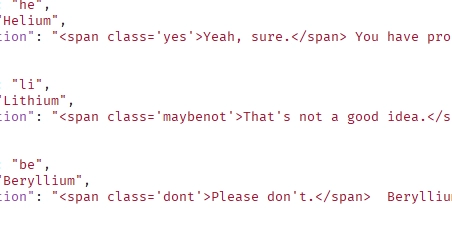
Image Credit: Dev
1️⃣ 🚀 Can I Lick It: Programming Journey.
- The author had an idea to turn a chart into a website using HTML, CSS, JS, and JSON.
- The website would display information about each element and whether it can be licked.
- The author is using a JSON file with 590 lines of data for the 118 elements of the periodic table.
- The author has been working on the project for 3 weeks and is using a VS Code extension to connect to Glitch for hosting.
Read Full Article
13 Likes
For uninterrupted reading, download the app