A naukri.com initiative
Data Science News
Analyticsindiamag
239

Image Credit: Analyticsindiamag
Wells Fargo Cuts 400 Jobs in India as GCCs Take a Back Seat
- Wells Fargo has cut nearly 400 jobs in its India operations over the past two months, affecting its engineering division and Chief Administrative Office.
- The layoffs are part of Wells Fargo's strategy to consolidate its global capability center (GCC) operations in India to adapt to economic and technological changes.
- The company aims to provide better career growth opportunities and service for clients by consolidating its Indian operations in Bengaluru and Hyderabad.
- The job cuts reflect larger trends in the global financial sector, driven by automation, AI adoption, and cost optimization to improve efficiency and productivity.
Read Full Article
14 Likes
Analyticsindiamag
178

Image Credit: Analyticsindiamag
The Luigi Warning: Can Indian Insurance Escape the AI Trap?
- Luigi Mangione shot UnitedHealthcare CEO due to resentment towards health insurance industry.
- India's insurance industry faces questions about transparency and fairness in AI adoption.
- Companies like Infosys and HCLTech are integrating AI to improve insurance processes.
- Concerns persist over biased AI results and lack of guidelines for fairness.
- Insurers are urged to adopt explainable AI and maintain ethical integrity in underwriting.
Read Full Article
10 Likes
Analyticsindiamag
400

Image Credit: Analyticsindiamag
OpenAI Built Codex in Just 7 Weeks From Scratch
- Calvin French-Owen, a former OpenAI employee, shared insights on the company's engineering practices and culture in a recent blog post.
- OpenAI developed the Codex coding agent in just seven weeks, described as a fast-paced and intense effort.
- French-Owen highlighted the team composition for Codex's development and the rapid decision-making processes at OpenAI.
- The company's culture encourages rapid idea implementation and autonomous project development, with a strong bias for action and ambitious pursuits.
Read Full Article
20 Likes
Analyticsindiamag
322

Image Credit: Analyticsindiamag
Google’s AI Agent Finds a Critical Security Flaw in SQLite
- Google's AI agent, Big Sleep, detected a critical security flaw in SQLite that was previously unknown and at risk of exploitation by threat actors.
- This marks the first time an AI agent was used to prevent the exploitation of a security vulnerability in real-world scenarios.
- The vulnerability, known as SQL CVE-2025-6965, could allow an attacker to execute arbitrary SQL statements leading to an array overflow.
- Google is also introducing new AI security features, including enhancing Timesketch with AI capabilities for faster incident response.
Read Full Article
19 Likes
Analyticsindiamag
203

Image Credit: Analyticsindiamag
Andrew Ng Launches AI Aspire, a Firm to Help Enterprises with Their AI Strategy
- Bain & Company partners with AI Aspire, Andrew Ng's advisory firm, to assist global enterprises in expanding AI operations.
- The collaboration combines Bain's sector expertise with Ng's AI and machine learning experience.
- The partnership aims to move beyond pilot projects towards driving enterprise-level outcomes and AI strategy integration within businesses.
- Bain's AI-driven business transformation demand has led to the partnership to leverage Bain's 1,500 professionals across various AI-related domains to support organizations in strategy implementation.
Read Full Article
3 Likes
Mit
43

Image Credit: Mit
How to more efficiently study complex treatment interactions
- MIT researchers develop theoretical framework for studying treatment interactions efficiently, aiding in estimating outcomes.
- Approach allows for fewer costly experiments but more accurate data collection in multiround experiments.
- Framework considers unbiased experiment design by assigning treatments in parallel to control outcomes.
- Technique may enhance disease understanding and aid in developing treatments for cancer, genetic disorders.
Read Full Article
2 Likes
VentureBeat
307

Image Credit: VentureBeat
OpenAI, Google DeepMind and Anthropic sound alarm: ‘We may be losing the ability to understand AI’
- Researchers from OpenAI, Google DeepMind, Anthropic, and Meta join forces to warn about AI safety.
- They stress the importance of monitoring AI reasoning to catch harmful intentions before actions.
- AI systems 'thinking out loud' in human language could offer transparency but face challenges.
- AI companies must preserve monitoring capabilities amidst technological advancements for safe AI development.
Read Full Article
18 Likes
Medium
172
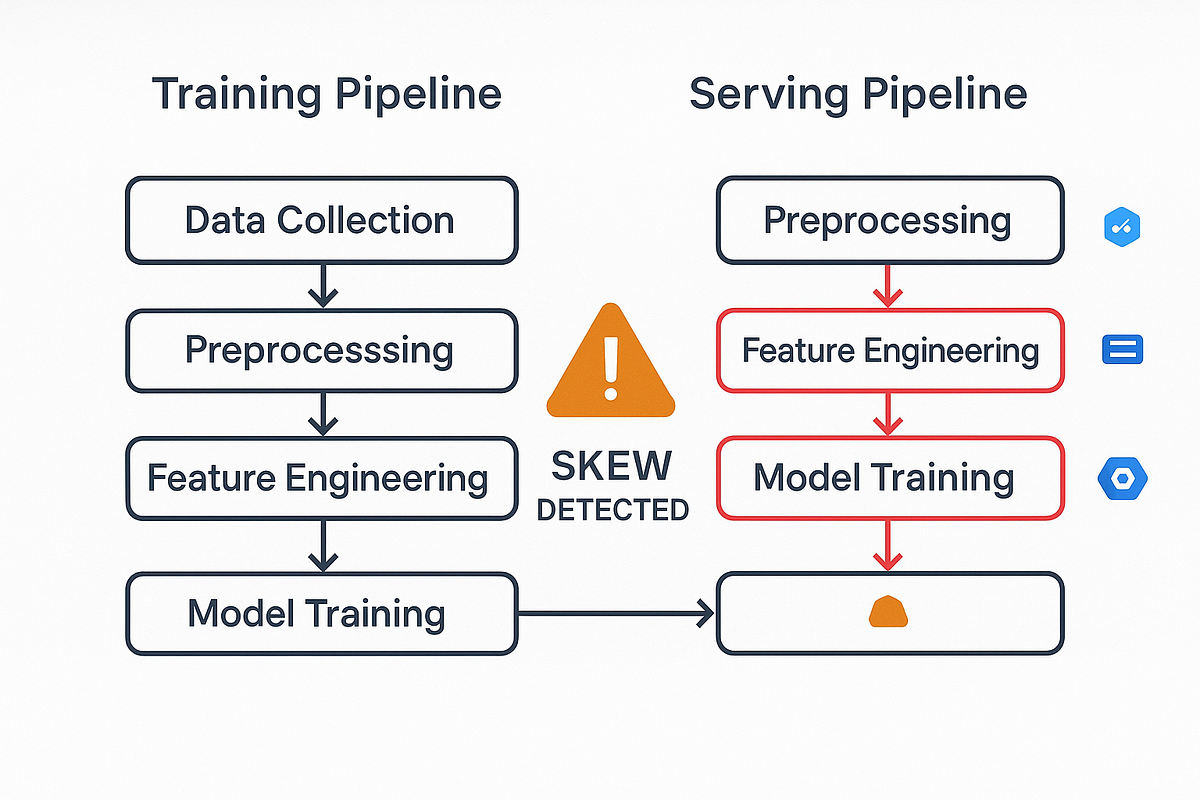
Image Credit: Medium
Why Most ML Models Die Before Production — How to Keep Them Alive?
- Dependency conflicts, deprecated libraries, and platform-specific issues can lead to model failures in production.
- Integrating ML models with existing systems can be challenging due to different languages and lack of APIs, hindering their deployment.
- Data and concept drift can render models useless as datasets evolve, leading to inaccurate predictions without proper monitoring.
- Discrepancies between preprocessing during training and production can cause large prediction errors, highlighting the importance of consistency.
Read Full Article
10 Likes
Analyticsindiamag
58

Image Credit: Analyticsindiamag
AI and Platform Engineering Face 42% Talent Gaps in Indian GCCs: Quess Corp
- Quess Corp's report 'India’s GCC Tech Talent Landscape' highlights a widening talent gap in roles like AI and platform engineering in Indian global capability centres.
- AI, data & analytics roles face a 42% talent shortage, while platform engineering has a 38% supply gap, with demand increasing for roles related to generative AI, MLOps, Kubernetes, and multi-cloud systems.
- Quess Corp's CEO emphasized the importance of talent retention and internal development for long-term success, stating that external hiring may not be a feasible solution due to high demand and limited availability of skills like AI and platform engineering.
- The report also highlights the need for investing in training existing employees and fresher intakes to build necessary capabilities, as there is a significant talent gap between strategic intent and operational readiness in tech-driven enterprises.
Read Full Article
3 Likes
Analyticsindiamag
47

Image Credit: Analyticsindiamag
Anthropic’s Claude to Take on Perplexity with Finance Analysis Abilities
- Anthropic has introduced a financial analysis solution that integrates Claude models with real-time data for market research, financial modeling, and compliance workflows.
- The offering competes with Perplexity in the financial sector and includes pre-built connectors to platforms like Snowflake, FactSet, and Databricks for accessing market data through a single interface.
- Benchmark tests by Vals AI show Claude Opus 4 outperforming peers in finance-specific reasoning and passing levels in the Financial Modeling World Cup.
- Anthropic's partners include Deloitte, PwC, and KPMG, aiding financial firms in deploying Claude for various financial tasks, positioning it as a secure and scalable AI solution for institutions.
Read Full Article
2 Likes
Analyticsindiamag
397

Image Credit: Analyticsindiamag
Infosys to Transform 300 Melbourne Catholic Schools with AI
- Infosys partners with Melbourne Archdiocese Catholic Schools to modernize digital systems in nearly 300 schools.
- The collaboration involves moving core operations to the cloud using platforms like SAP S/4HANA Cloud and SAP SuccessFactors.
- The upgrade aims to streamline operations, reduce administrative tasks, improve data access, and pave the way for future AI integration.
- The initiative includes secure identity access tools, improved data management, and end-to-end managed services by Infosys.
Read Full Article
23 Likes
Medium
198
Image Credit: Medium
Why Class 10 Students Are Studying Artificial Intelligence — And Why It’s Great
- Class 10 students are now studying Artificial Intelligence as a skill subject introduced by the CBSE board.
- The course focuses on understanding, questioning, and creating technology, not just using it.
- The curriculum includes building life skills, learning Python, hands-on coding, and creating AI projects like predicting marks.
- The goal is to prepare students for future jobs that will involve AI, regardless of whether they choose a career in tech or not.
Read Full Article
7 Likes
Analyticsindiamag
147

Image Credit: Analyticsindiamag
Mistral Unveils Voxtral, Its Open-Source Bet to Rival OpenAI and ElevenLabs
- French AI startup Mistral has launched Voxtral, an open-source alternative to proprietary speech understanding models like OpenAI Whisper and ElevenLabs Scribe.
- Voxtral offers a 24B version for large-scale usage and a 3B 'Mini' version for edge applications, supporting various languages and direct question answering.
- Benchmark results indicate Voxtral outperforms competitors in transcription and multilingual tasks, boasting state-of-the-art performance in English and European languages.
- Mistral also introduced Magistral, a reasoning-focused language model, and is actively hiring to enhance its audio team for developing advanced voice interfaces.
Read Full Article
8 Likes
Medium
98

Image Credit: Medium
Accuracy Metrics in Machine Learning: A Quick Guide
- Confusion Matrix: Actual vs. predicted classifications, includes TP, TN, FP, FN.
- Accuracy: Measures correct predictions, useful for balanced data.
- Precision: Measures true positives among predicted positives, important in costly false alarms.
- Recall: Measures caught positives among actual positives, critical when missing cases is risky.
Read Full Article
5 Likes
VentureBeat
514

Mira Murati says her startup Thinking Machines will release new product in ‘months’ with ‘significant open source component’
- Mira Murati's startup Thinking Machines secures $2 billion funding for upcoming product.
- The product, with significant open source elements, is anticipated by AI enthusiasts.
- Team members express excitement over the ambitious AI program and research infrastructure.
Read Full Article
25 Likes
For uninterrupted reading, download the app