A naukri.com initiative
Cryptopotato
1M
63
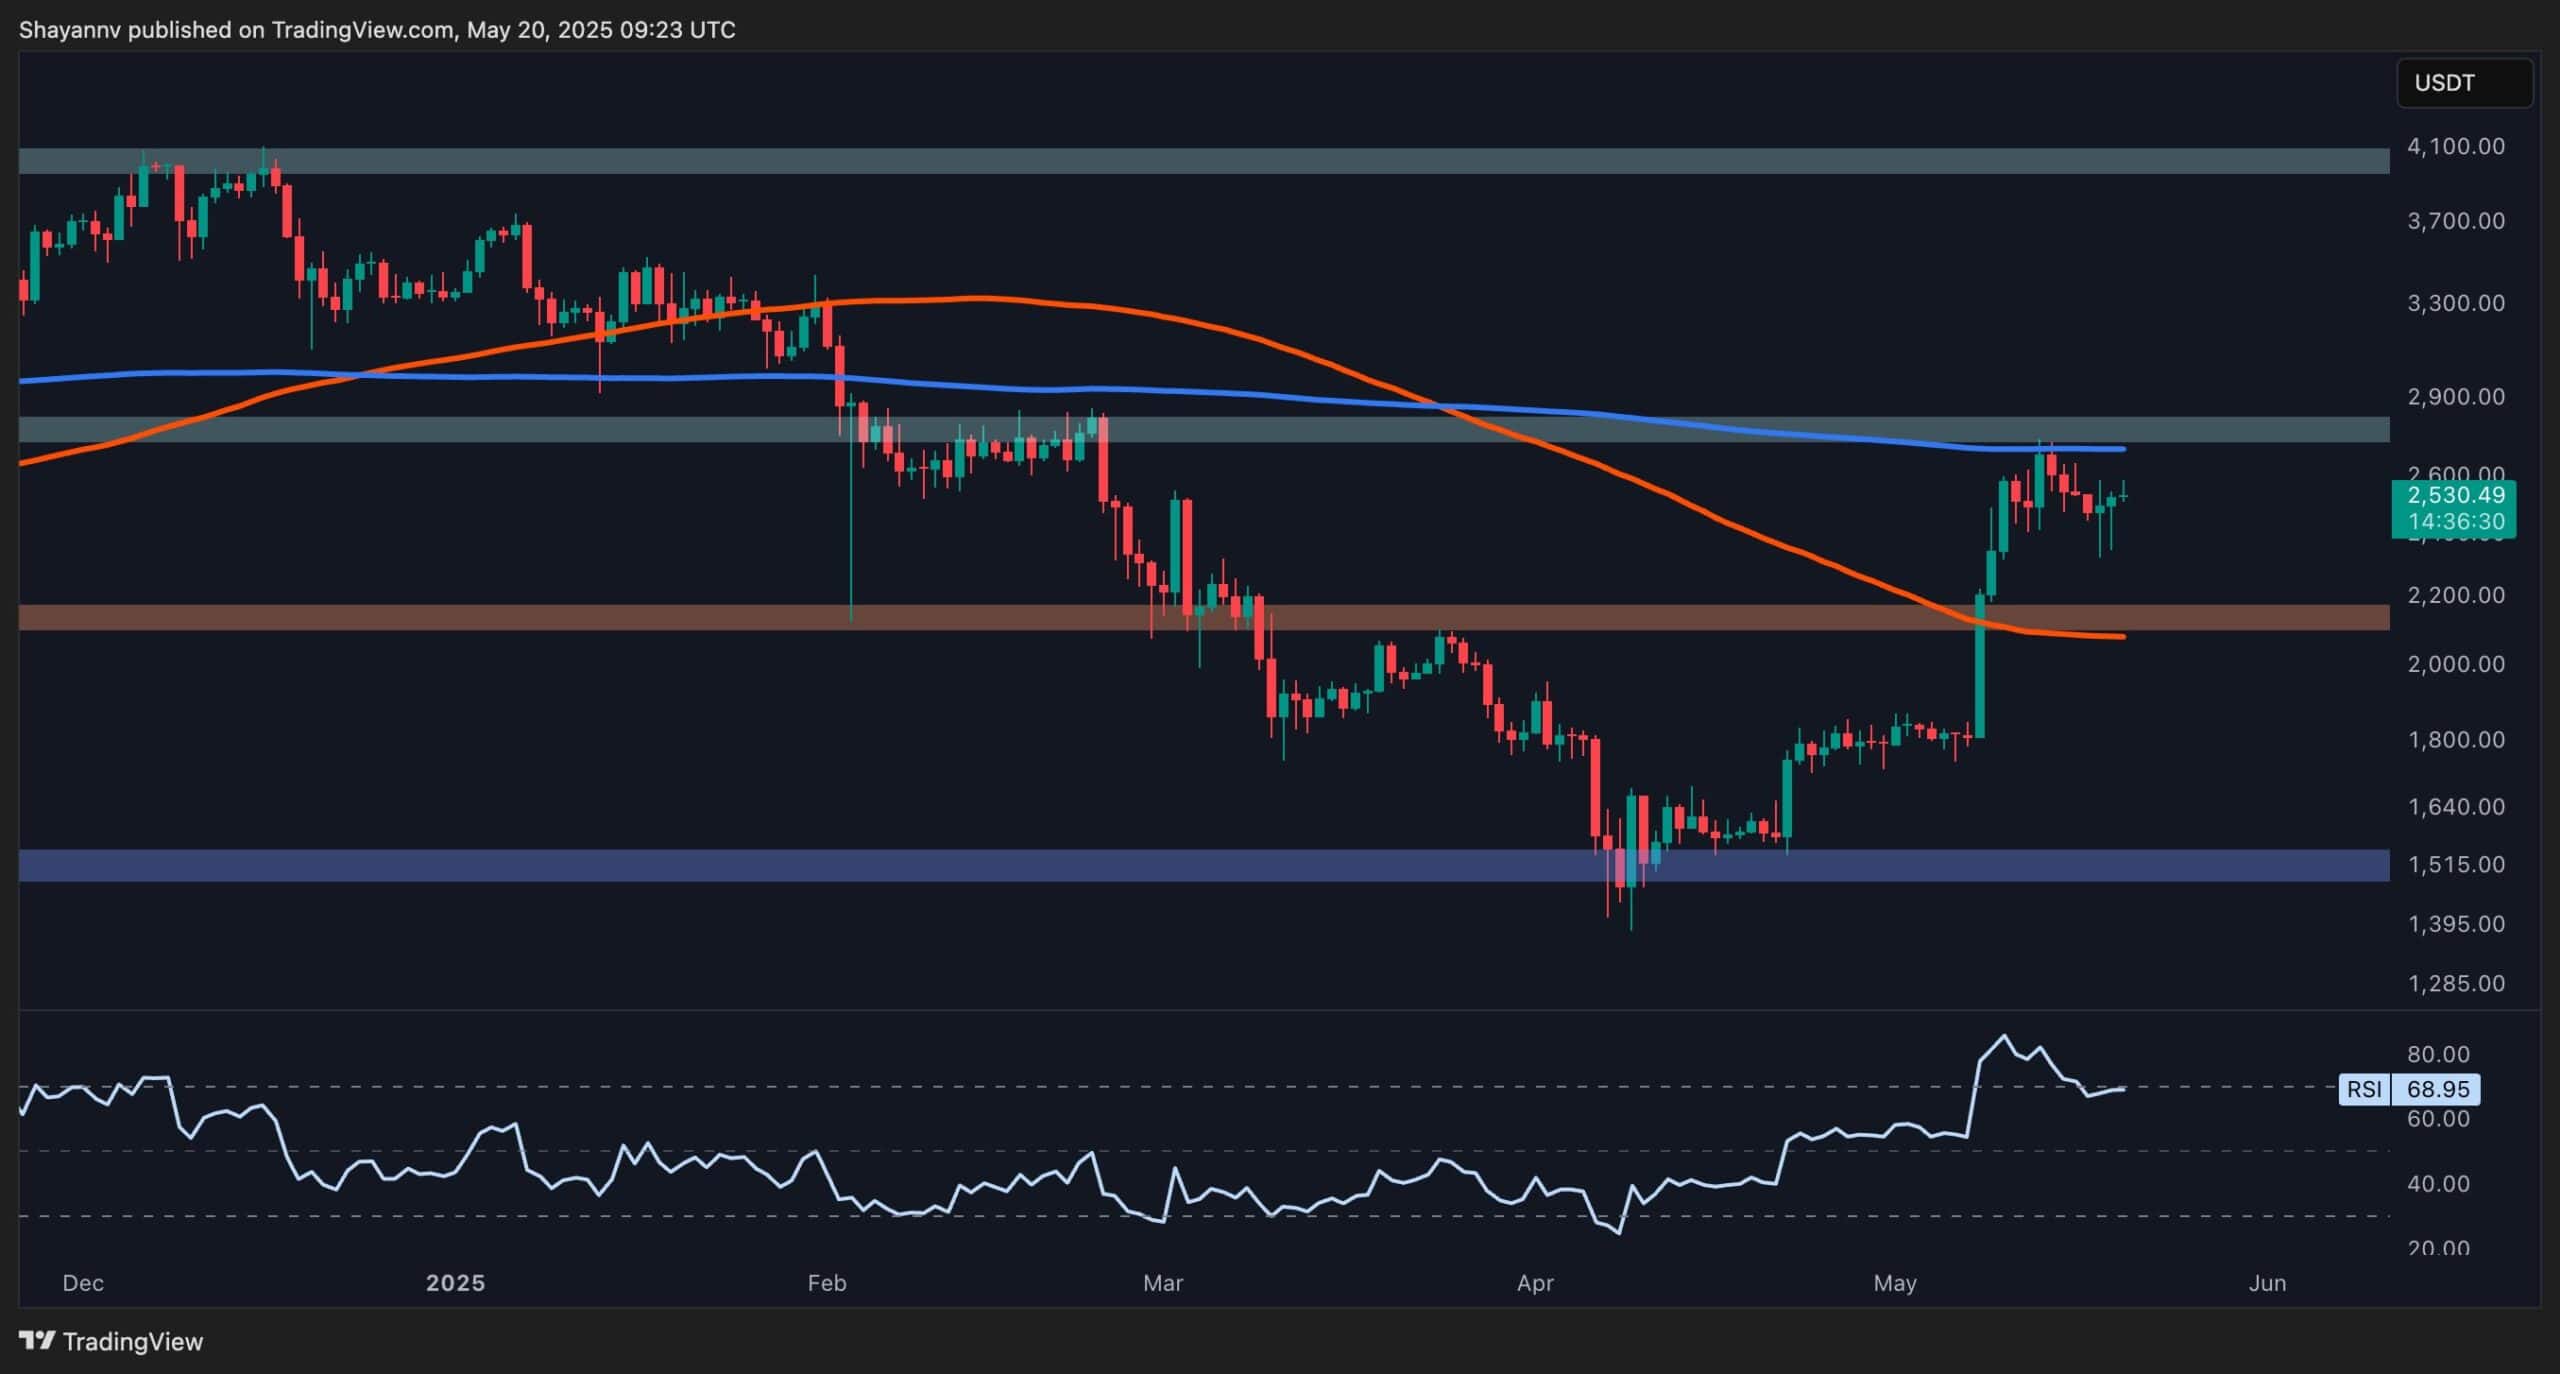
Image Credit: Cryptopotato
Ethereum Price Analysis: ETH Testing Crucial Resistance Line, Is $3K Next?
- Ethereum is testing a crucial resistance line near the 200-day moving average at $2.5K, leading to a consolidation phase.
- Market structure and momentum suggest a potential bullish breakout in the mid-term despite the possibility of a short-term correction due to overbought conditions.
- On the daily chart, a breakout above $2.5K could indicate a broader bullish reversal, with a target towards $3K, while a consolidation phase within $2.1K–$2.5K range is likely in the short term.
- The 4-hour chart shows Ethereum's rally stalling at $2.5K, forming a bullish continuation wedge, hinting at a potential breakout or correction depending on the pattern's development.
Read Full Article
3 Likes
For uninterrupted reading, download the app