A naukri.com initiative
Cryptopotato
2M
431
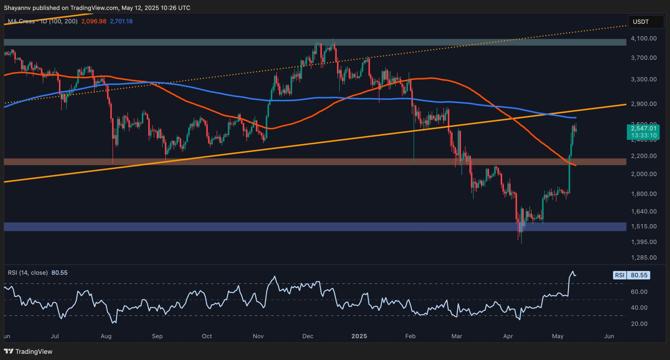
Image Credit: Cryptopotato
Ethereum Price Analysis: Is ETH Due for a Correction After 42% Weekly Surge?
- Ethereum has surged significantly, approaching a crucial resistance level at $2.6K, but faces strong resistance factors at this range, hinting at a likely consolidation before the next major move.
- Technical analysis on the daily chart indicates that ETH is at a critical resistance zone near $2.6K, marked by the 200-day moving average and a previously broken ascending channel boundary, suggesting a potential corrective phase is needed for market stabilization.
- On the 4-hour chart, Ethereum's buying momentum has pushed it through multiple resistance levels, aiming for all-time highs. However, a key supply zone at $2.6K may trigger a short-term pause or consolidation, more likely given the overbought RSI levels.
- Onchain analysis reveals that Ethereum's recent surge seems driven by spot market demand rather than excessive leverage in futures markets, indicating a more stable and organic uptrend. Sustained bullish momentum hinges on a potential rise in funding rates to reflect increased confidence among futures traders.
Read Full Article
25 Likes
For uninterrupted reading, download the app