A naukri.com initiative
Cryptopotato
1M
254
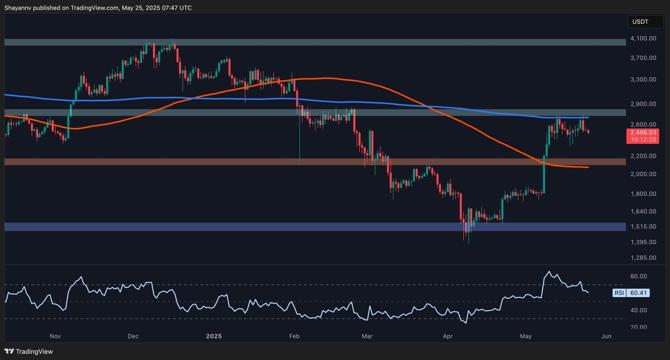
Image Credit: Cryptopotato
Ethereum Price Analysis: Is ETH Primed for a ‘Healthy’ Correction?
- Ethereum is struggling to reclaim the 200-day MA of $2.7K and forming a double-top pattern, hinting at a potential corrective phase towards $2.2K.
- ETH's Daily Chart shows strong resistance at $2.7K, forming a double-top pattern, pointing towards a short-term correction before a breakout.
- On the 4-Hour Chart, Ethereum's price is within an ascending wedge, signaling weakening momentum and potential pullback to $2.2K.
- Onchain Analysis indicates increased selling activity, with the possibility of a deeper correction to $2.2K unless aggressive selling subsides, paving the way for a bullish breakout.
Read Full Article
15 Likes
For uninterrupted reading, download the app