A naukri.com initiative
Dev
1M
45
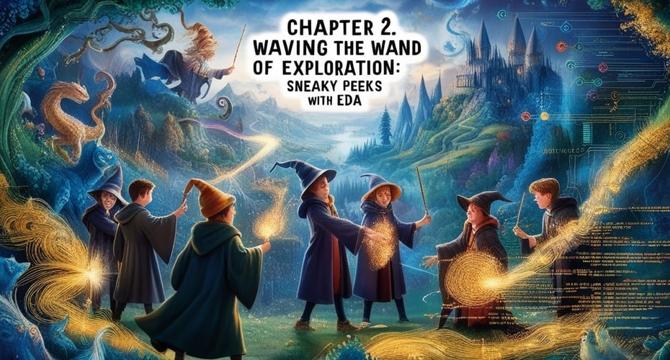
Image Credit: Dev
Gemika’s Enchanted Guide to Iris Dataset with Magic and Machine Learning 🌟🧙♂️ (Part #2)
- Professor Gerry Leo Nugroho guides readers through Exploratory Data Analysis (EDA) on the Iris Dataset, likening it to magical exploration in Hogwarts.
- EDA involves counting blooms, measuring quirks, and spotting patterns to reveal hidden secrets similar to using magic in Harry Potter.
- Using Python, the article demonstrates EDA techniques on the Iris Dataset, providing insights into the dataset's characteristics and unique species present.
- Through functions like head() and describe(), the dataset's statistical summary is displayed, akin to uncovering the dataset's heartbeat with magical spells.
- Gemika, the young Gryffindor, engages in the EDA process, transforming numbers into meaningful insights about the flowers' traits and sizes.
- The Hogwarts-themed exploration of data includes relating EDA to classifying magical creatures, dragons, and other whimsical entities in the wizarding world.
- EDA is portrayed as a tool for curiosity and discovery, akin to researching creatures for Hagrid, trying out for Quidditch, or exploring the magical realm of Hogwarts.
- Gemika's quiz injects an interactive element into the article, prompting readers to engage in understanding the significance of numbers in EDA.
- The article teases the next chapter, promising a vibrant array of interactive visualizations using seaborn and plotly, suggesting a whimsical journey ahead.
- Stay tuned for a colorful and enchanting experience in the upcoming chapter, where readers will dive into the magical world of visual representations through data visualization.
- Prepare for an immersive journey filled with laughter, surprises, and captivating insights as the exploration of the Iris Dataset continues with interactive visualizations.
Read Full Article
2 Likes
For uninterrupted reading, download the app