A naukri.com initiative
Self-Learning-Java
2w
94
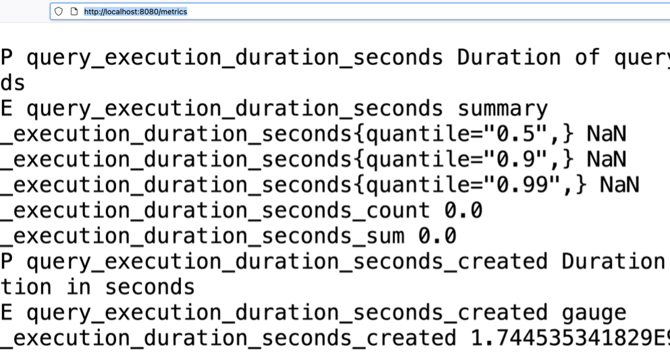
Image Credit: Self-Learning-Java
How to expose Summary metric using Prometheus Java Client?
- A Summary metric in Prometheus is used to track individual observations and calculate quantiles over time.
- It provides count, sum, and optional quantile values for the observations.
- Summary metrics are useful for tracking response times, latency, GC time, and operation durations.
- To define a Summary object, you can specify the name, help, and quantile values.
- Quantile calculations involve sorting observations and determining percentile values.
- An application example demonstrates creating a Summary metric for query execution duration.
- The server setup includes endpoints for simulating queries and exposing metrics.
- Viewing metrics reveals quantile values, count, sum, and average execution time.
- Quantiles are approximations maintained through sampling algorithms by Prometheus client libraries.
- Summary metrics help analyze the distribution of observations for better insights into system performance.
Read Full Article
5 Likes
For uninterrupted reading, download the app