A naukri.com initiative
Self-Learning-Java
2w
133
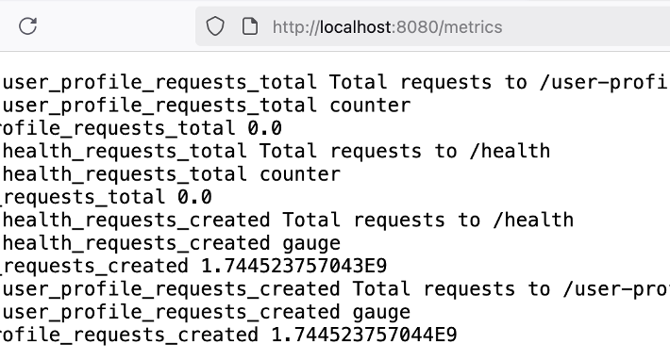
Image Credit: Self-Learning-Java
How to Track Endpoint Usage with Prometheus Counters in Java?
- Prometheus Counters are used to track metrics that only increase, like the total number of requests in an application.
- Counters measures how many times something has happened, such as HTTP requests or errors occurred.
- Naming conventions for Counters require unique names starting with a letter and ending with _total.
- A sample Java application is created to expose endpoints like /health and /user-profile, while incrementing respective Counters.
- Metrics are scraped by Prometheus from the /metrics endpoint using CollectorRegistry.defaultRegistry.metricFamilySamples() method.
- The output from /metrics includes metadata comments describing the metric purpose, type (counter or gauge), and the current value.
- Automatically added *_created metrics in Prometheus indicate the time a Counter was created, aiding in troubleshooting and monitoring.
- Prometheus UI can be configured to display these metrics by updating the prometheus.yml file and attaching the target.
- Using Prometheus queries like rate(user_profile_requests_total[5m]) helps analyze the rate of requests coming to specific endpoints.
- Monitoring tools like Grafana can leverage timestamps to detect when a metric was first seen and calculate metric age.
Read Full Article
8 Likes
For uninterrupted reading, download the app