A naukri.com initiative
Medium
7d
308
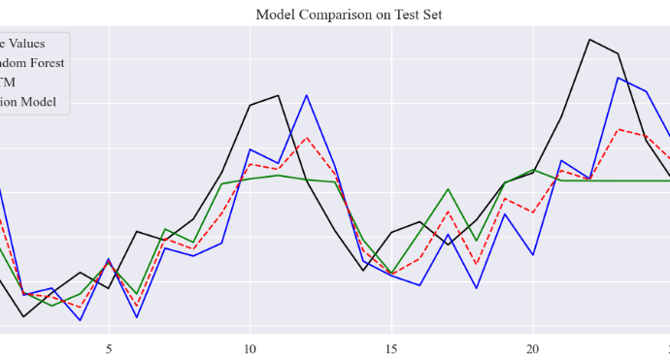
Image Credit: Medium
Mastering Univariate Time Series Forecasting: Build a RF-LSTM Fusion Model with Real-World Cases &…
- The fusion model of Random Forest and LSTM solves the problem of time series prediction, forecasting future trends based on historical data like temperature or stock prices.
- The fusion model integrates features from lagged time series data to capture historical effects and uses LSTM to learn long-term dependencies in data sequences.
- After predicting with Random Forest and LSTM, the fusion model averages the results to improve stability and accuracy of the predictions.
- A visualization compares the true values with predictions from Random Forest, LSTM, and the fusion model, showing the fusion model's smoother trend.
- A Mean Squared Error (MSE) Bar Chart illustrates that the fusion model has the smallest prediction errors, indicating its superiority over the other models.
- An Error Distribution Diagram helps compare the error concentration and skewness of prediction errors between the models, with a closer-to-zero distribution indicating more stability.
Read Full Article
18 Likes
For uninterrupted reading, download the app