A naukri.com initiative
Coindoo
1M
331
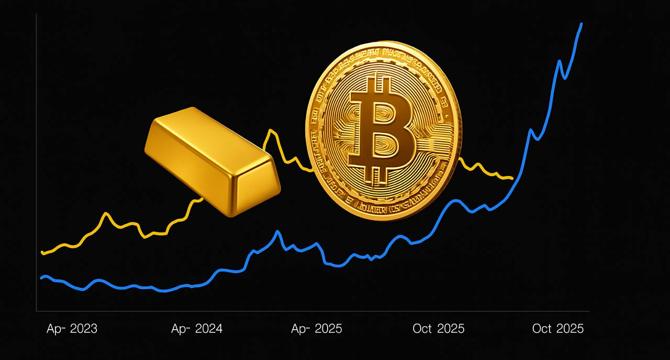
Image Credit: Coindoo
Peter Brandt Spots Gold Pattern Resembling Bitcoin’s 2024 Breakout Structure
- Peter Brandt highlighted an expanding inverted triangle formation on gold’s daily chart, resembling the technical structure BTC had in 2024 before rallying.
- Brandt's analysis suggests that gold may be on the verge of a significant move higher if the breakout from the descending wedge within an expanding triangle confirms.
- Brandt compared gold's current chart to Bitcoin's CME futures chart from 2024, showing a similar pattern of a breakout from a descending wedge converging with an inverted triangle.
- The implication is that if gold follows a similar structure to Bitcoin in 2024, it could soon experience upward momentum like Bitcoin did last year, transitioning from consolidation to new highs.
Read Full Article
19 Likes
For uninterrupted reading, download the app