A naukri.com initiative
Cryptopotato
2M
252
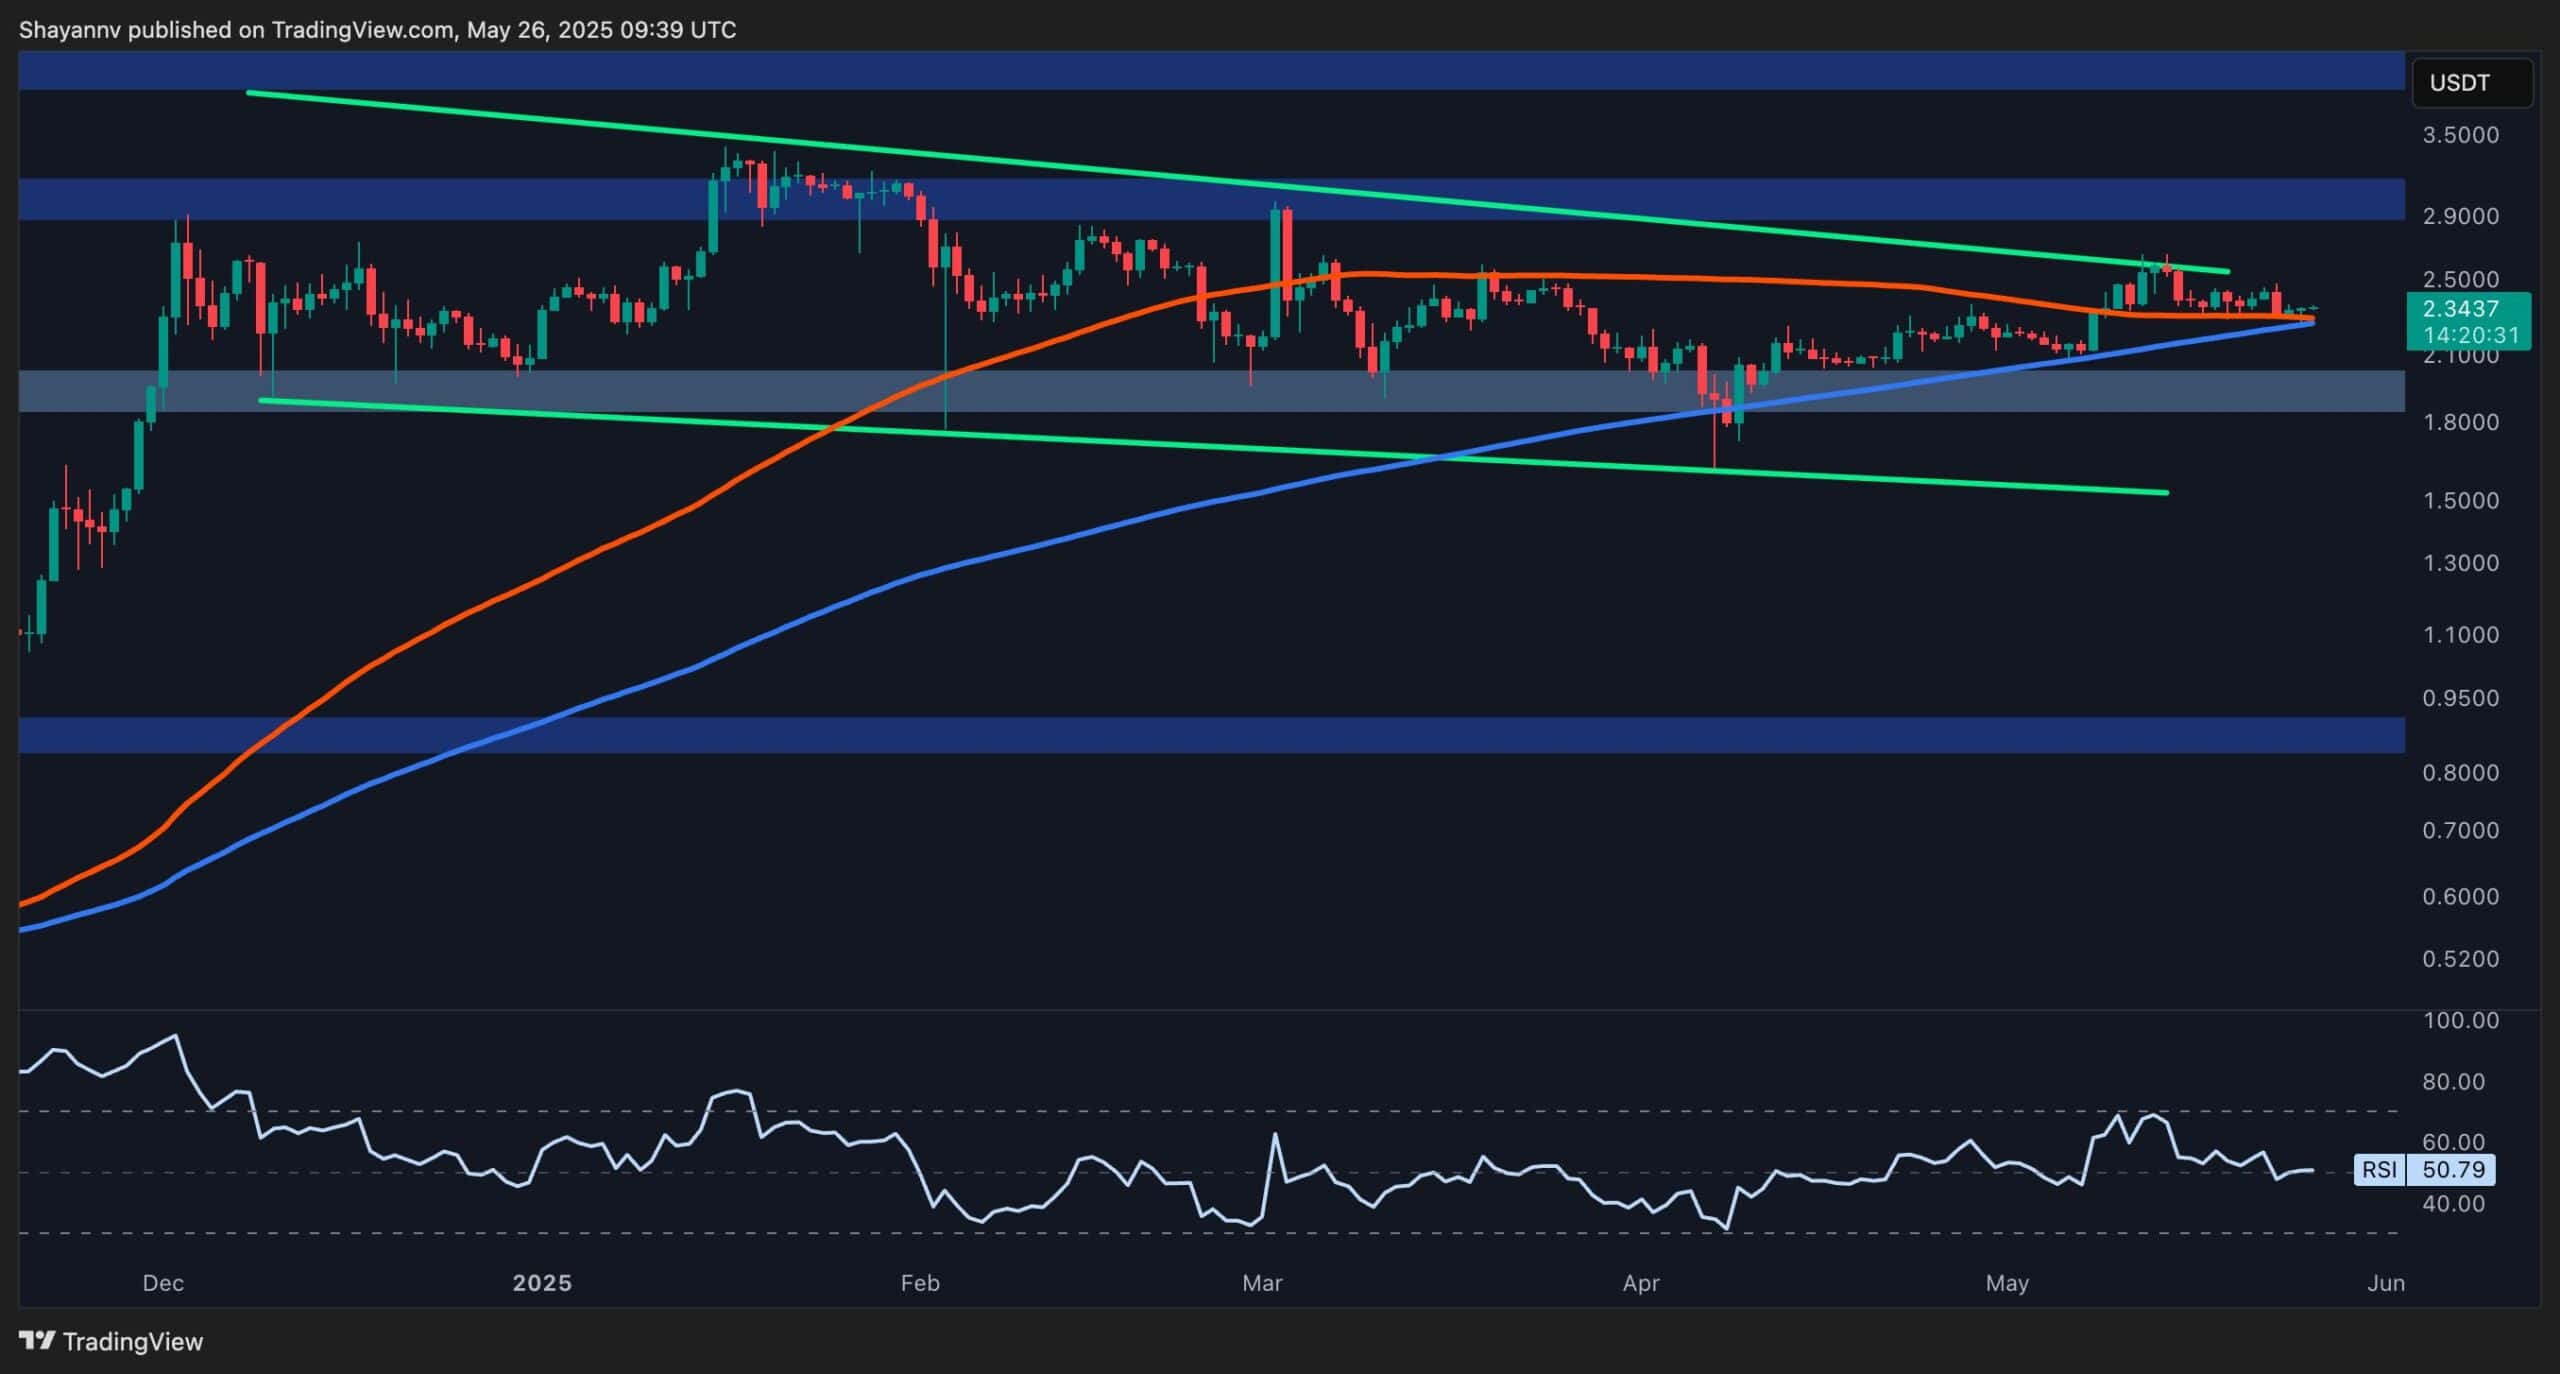
Image Credit: Cryptopotato
Possible Scenarios for XPR Once it Breaks Out of Consolidation: Ripple Price Analysis
- Ripple's XRP remains within a narrow price range with minimal fluctuations, indicating a potential breakout soon to define the next trend.
- On the daily chart, XRP is trading between the 100-day and 200-day moving averages at $2.2 and the upper boundary of a descending wedge around $2.5, a crucial battleground for bulls and bears.
- A break above the descending wedge could lead to a bullish rally towards $3.3, while failure to surpass the $2.5 resistance may result in a bearish rejection towards $2.
- On the 4-hour chart, XRP has formed a short-term descending wedge near $2.2, showing low volatility. A break above $2.4 could signal a bullish breakout towards $2.8, while a drop below $2.2 may lead to downside towards $2.
Read Full Article
15 Likes
For uninterrupted reading, download the app