A naukri.com initiative
Self-Learning-Java
1w
300
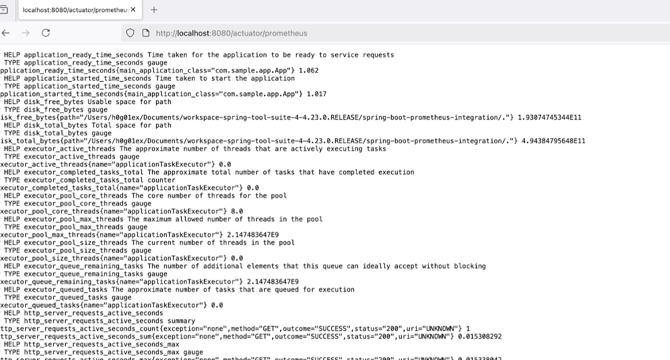
Image Credit: Self-Learning-Java
Spring Boot and Prometheus Integration Step by Step Guide
- Prometheus is an open-source monitoring and alerting toolkit used in modern software systems like microservices and cloud-native applications.
- It works by scraping metrics from instrumented applications at defined intervals and storing them in a time-series database.
- Spring Boot Actuator provides various application metrics such as memory usage, thread count, CPU usage, etc., which can be integrated with Micrometer and Prometheus.
- Enabling Prometheus in a Spring Boot app allows monitoring, alerting, visualization of metrics in Grafana, tracking usage patterns, and debugging with data-backed insights.
- Common use cases for Prometheus integration include monitoring API response times, tracking active threads or connections, checking JVM memory stats, measuring custom business metrics, and enabling auto-scaling decisions.
- The step-by-step guide involves creating a Maven project, updating the pom.xml file with dependencies, configuring the application.yml file, defining controller and main application classes, and running the application.
- Additionally, configuring Prometheus to read metrics from the Spring Boot app involves defining endpoints in the prometheus.yml file and starting the Prometheus server.
- Further steps include running Prometheus server, viewing configured targets, and querying metrics like process_cpu_time_ns_total from the Java Spring Boot application.
- Micrometer is highlighted as a metrics instrumentation library for Java applications, offering a unified API to collect and expose application metrics.
Read Full Article
18 Likes
For uninterrupted reading, download the app