A naukri.com initiative
Medium
1M
343
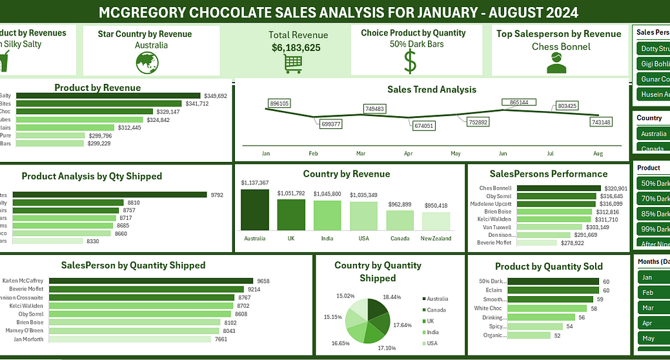
Image Credit: Medium
Technical Report on Chocolate Sales Dashboard Analysis – 2024
- The dataset for the Chocolate Sales Dashboard Analysis includes sales transactions spanning from January to August 2024, with columns such as Product Name, Country, Quantity Sold, Revenue, Salesperson, and Date.
- Objectives of the analysis include identifying top-performing products by revenue and quantity, evaluating sales performance by country and salesperson, discovering trends and seasonality in monthly sales, and translating insights into business recommendations.
- Key metrics focused on include Total Revenue, Total Quantity Sold, Product Performance, Regional Sales Distribution, Salesperson Performance, and Monthly Trends.
- The analysis revealed insights such as the highest revenue generated by Smooth Silky Salty, the highest units sold by 50% Dark Bars, Australia leading in both revenue and volume, and recommendations like increasing promotion for top products and targeting underperforming regions for growth.
Read Full Article
20 Likes
For uninterrupted reading, download the app