TechUniverses
2w
212

Image Credit: TechUniverses
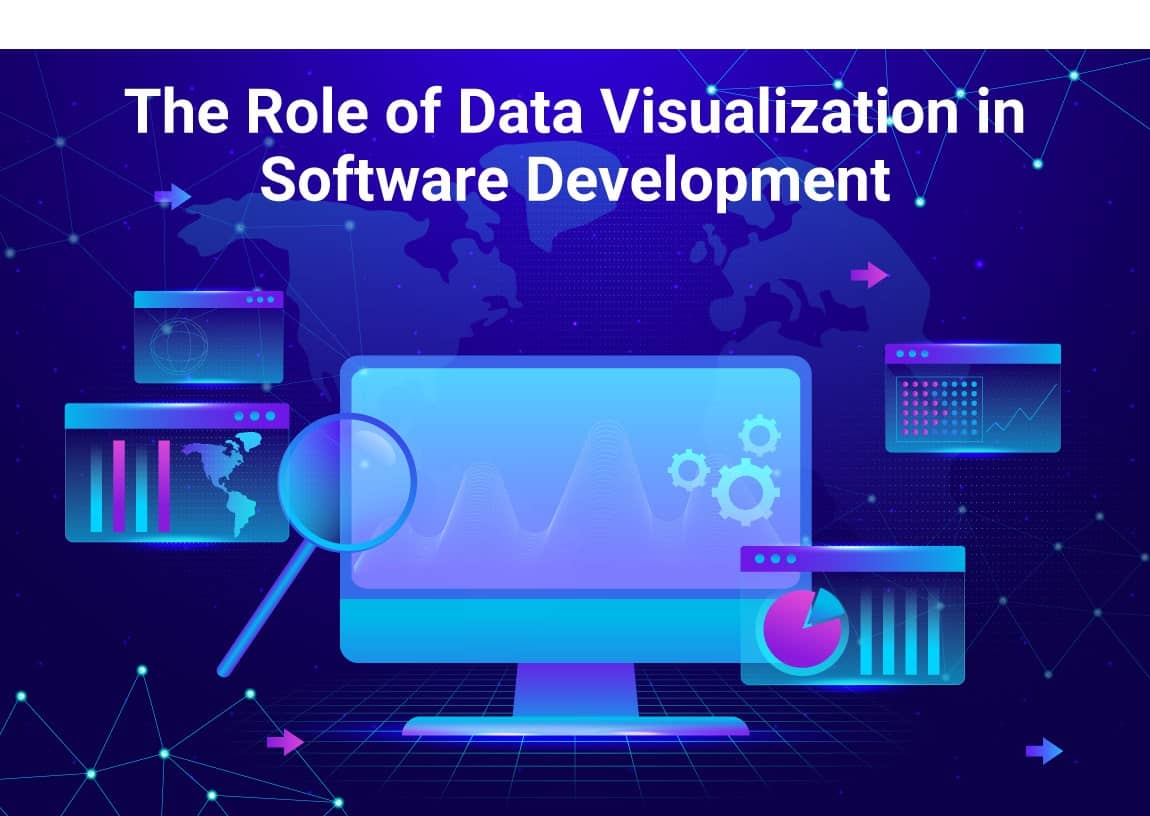
The Role of Data Visualization in Software Development
- Data visualization helps developers understand complex information by presenting it in a visual format.
- It plays a crucial role in debugging, performance monitoring, and user experience design.
- Visual tools like heatmaps and performance dashboards help identify issues faster, improve software quality, and communicate insights more efficiently.
- Teams use visual tools like burn-down charts, Gantt charts, and Kanban boards to track project progress, stay organized, identify bottlenecks early, and ensure steady progress.
- Knowing how people use software plays a crucial role in making it more user-friendly and engaging.
- API monitoring dashboards display real-time metrics, including response time, error rates, and request volumes, helping teams detect issues before they affect users.
- Security dashboards assist in constantly monitoring the system and tracking login attempts, failed authentications, and unusual access patterns in real-time.
- Custom data visualization software helps teams respond quickly, prevent data breaches, and keep user information safe.
- Data visualization in software development simplifies the process for developers to comprehend and deal with tough data.
- Visualizing data helps bring coordination and effective collaboration, and it helps in bringing a smooth development workflow while providing the best user experience.
Read Full Article
12 Likes
For uninterrupted reading, download the app