A naukri.com initiative
Self-Learning-Java
1M
99
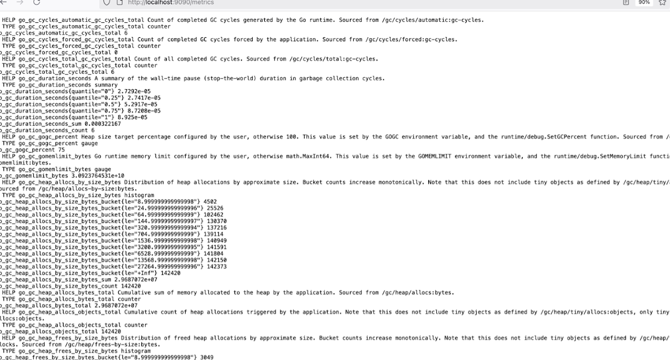
Image Credit: Self-Learning-Java
Understanding Prometheus Metrics for Beginners
- Prometheus metrics provide insights into the performance of applications and systems, helping monitor their health.
- In a Prometheus configuration file, targets are specified for scraping metrics at defined intervals.
- Metrics retrieved from Prometheus are accessible via the /metrics endpoint.
- Prometheus metrics consist of helpful components like HELP, TYPE, metric name, and value.
- Common metric types in Prometheus include counter, gauge, summary, and histogram.
- Counters are ideal for tracking values that only increase, like memory usage or request counts.
- Gauges represent numerical values that can fluctuate over time and are suitable for current-state tracking.
- Summary metrics in Prometheus track events and their durations, providing insights into distributions.
- Histogram metrics in Prometheus enable the observation of data distribution in predefined buckets.
- Understanding Prometheus metrics, their types, and usage can optimize monitoring and troubleshooting processes.
Read Full Article
5 Likes
For uninterrupted reading, download the app