A naukri.com initiative
Altcoins News
Bitcoinist
101

Image Credit: Bitcoinist
Ethereum Historic Rally Brewing: New All-Time High Within Reach In 2025
- Ethereum is showing signs of regaining strength and stabilizing above $2,500 level.
- Predictions in the crypto community hint at a major rally in the near future.
- Crypto expert Batman believes Ethereum is poised for a historic breakout in 2025 towards new all-time highs.
- Analysis on the 4-hour chart suggests Ethereum is preparing for a significant move.
- Anticipated catalysts could propel ETH past $4,000, initiating a sharp surge.
- Ethereum may rally to $6,000 and $8,000 this year, fueling a new price peak.
- The golden cross on ETH's Stochastic in the 12-hour chart indicates a potential shift to a bullish trend.
- This technical move has historically signaled a local bottom and the start of significant rallies.
- As ETH trades in a narrow range, experts anticipate a big price movement once a breakout occurs.
- Daan Crypto Trades highlights the importance of watching for a close above or below the current range to confirm the trend direction.
Read Full Article
6 Likes
Coindoo
70

Image Credit: Coindoo
Tether Dominance Surges as USDC Retreats from Exchanges
- Tether has added over $12 billion in new supply on Ethereum in 2025, with USDT flowing to exchanges.
- Total stablecoin supply surged, reinforcing Tether's central role in crypto trading infrastructure.
- USDC reveals a decrease in netflows, indicating institutional pullback from exchanges.
- Traders rely more on USDT for liquidity, leading to USDC's decreasing presence.
- Tether now dominates with 78% of stablecoin liquidity, posing risks for smaller tokens.
- Imbalance in stablecoin liquidity raises concerns for market stability during stress.
- USDC retreat from exchanges highlights the growing importance of diversified stablecoin liquidity.
- Concerns emerge about liquidity concentration and reliance on Tether within the stablecoin market.
- Rising Tether supply and exchange presence contrast with USDC's declining netflows.
- USDT's $1 peg remains strong amid its significant growth in supply.
- Institutions pulling USDC off exchanges signal a trust shift towards Tether for liquidity.
- Market dynamics indicate Tether's increasing dominance and resilience despite calls for decentralization.
- The stability and consistency of Tether operations stand out amidst its rapid expansion.
- The disparity in behavior between Tether and USDC reshapes the stablecoin landscape.
- Concerns arise about the impact of Tether's dominance on altcoins and smaller projects.
- The article emphasizes the need for diversified stablecoin liquidity for ecosystem resilience.
Read Full Article
4 Likes
TronWeekly
171

Image Credit: TronWeekly
Toncoin (TON) Trades at $2.98 as Bulls Eye Breakout from Sideways Trend
- Toncoin (TON) is trading at $2.98, up 0.54%, amidst a narrow trading range of $2.85–$3.20.
- On the daily chart, low volume and sideways movement are noted, while the 4H chart indicates a potential bullish trend.
- Technical analysis reveals tight Bollinger Bands, a rising RSI at 53.49, and a bullish MACD crossover, suggesting a breakout.
- A breach above $3.00 resistance could target $3.20–$3.50, while a drop below $2.90 might lead to $2.70 support test.
- Toncoin's recent trading patterns reflect hesitation among traders after a decline from the April high near $4.30.
- Traders anticipate a breakout as TON consolidates within a defined price range.
- The 4-hour chart hints at potential bullish momentum building up as Bollinger Bands tighten and TON trades above the 20-period SMA.
- The RSI climbing to 53.49 and MACD displaying a bullish crossover bolster the case for an upward move.
- To affirm a reversal, TON must surpass the $3.00 mark, potentially opening the path to $3.20 and $3.50 targets.
- A failure to maintain above $2.90 support may trigger a descent towards $2.70.
- Traders closely monitor Toncoin's price action at this critical juncture, anticipating a breakout from the current consolidation phase.
Read Full Article
10 Likes
Coindoo
158
Image Credit: Coindoo
Aptos and Solana Tie as Top Blockchains for Wyoming’s WYST Stablecoin
- Aptos and Solana both received the highest evaluation score of 32 points for Wyoming's WYST stablecoin project.
- The stablecoin, named WYST (Wyoming Stable Token), will be issued using LayerZero's cross-chain protocol.
- Agency resources reviewed candidate blockchains based on technical robustness and vendor support.
- Three blockchains met the criteria, while one was disqualified over infrastructure concerns.
- APT and Solana were selected as the top platforms for WYST's issuance and distribution.
- The Q1 2025 evaluation by the commission focused on transparency and cross-agency collaboration.
- The initiative marks the first official stablecoin backed by a state government in the U.S.
- Deployment of WYST is set for later this year, aiming to showcase public-sector innovation with blockchain technology.
Read Full Article
9 Likes
Bitcoinsensus
158

Image Credit: Bitcoinsensus
DOGE Price Prediction: Read This Before Is Too Late
- Dogecoin recently dipped below a key demand zone, indicating potential manipulation in the market.
- Despite showing a strong long setup initially, the price reverted to break-even levels.
- Current liquidity levels suggest a possible upward movement, although outcomes remain uncertain.
- The recent Dogecoin price action demonstrated unexpected surprises despite favorable conditions.
- An identified demand zone initially provided a promising setup for traders.
- Although a bounce occurred, many traders likely ended up back at break-even due to subsequent price movements.
- Liquidity plays a crucial role in market movements, with Dogecoin sweeping liquidity below a certain level.
- There is now a notable stack of liquidity resting above, hinting at potential future price movements.
- The short-term bias for Dogecoin leans bullish, considering the current market structure and liquidity positioning.
- However, predicting market movements with certainty remains challenging due to inherent market unpredictability.
- Traders are advised to be cautious and watch for confirmation signals, like structure breaks and increased volume.
- While there are indications favoring a bullish scenario, Dogecoin's historical unpredictability adds an element of uncertainty.
- The market for Dogecoin has been indecisive, with the potential for both short-term upside and extended consolidation.
- The current situation may be a zone for accumulation, but the direction of the market remains uncertain.
- Trading decisions should consider risk management strategies due to the volatile nature of Dogecoin and the broader cryptocurrency market.
Read Full Article
9 Likes
TronWeekly
405
Image Credit: TronWeekly
Chainlink Price Prediction: Eyes Breakout Toward $13.80 and $14.20 Levels
- Chainlink's price hovers around $13.15 despite a 2.70% weekly decline.
- Indicators suggest a potential breakout near key resistance levels.
- Technical charts show buying interest following a failed rally toward $14.00 last week.
- Momentum indicators indicate a shift towards renewed upward movement.
- Chainlink's 24-hour volume is $266.73 million, with a market cap of $8.64 billion.
- Recent stability in prices masks a decline, with traders watching for bullish signals.
- After approaching $14.00, LINK experienced a rapid drop below $13.00.
- The token has been consolidating in a narrow range between $12.75 and $13.25.
- Market indecision suggests a need for clear direction or external factors for movement.
- Bullish Bollinger Bands and a slightly bullish RSI indicate potential for a breakout.
- The MACD indicator shows early bullish momentum with a recent crossover.
- Key resistance levels at $13.80 and $14.20 could be targets if $13.31 is breached.
- A close below $13.00 may lead to further losses towards $12.75 and $12.50.
- Traders are monitoring levels as Chainlink approaches a critical juncture.
- Overall, technicals point towards a potential breakout for Chainlink in the near term.
Read Full Article
24 Likes
Cryptoticker
83
Image Credit: Cryptoticker
Can PEPE Coin Survive This Drop?
- PEPE coin, a popular meme token, is experiencing a decline in price after a previous rally, prompting speculation about its future performance.
- The current PEPE coin chart shows weakness, with the price around $0.00001028, indicating a bearish trend.
- Key support levels for PEPE coin include $0.00001000 and $0.00000820, while resistance levels are at $0.00001350, $0.00001680, and $0.00002000.
- The RSI suggests bearish momentum, with potential for further downside if support is broken.
- Possible retracement levels could lead to a 20.23% downside if support at $0.00001000 is breached, or a 31.33% upside if a bounce occurs to $0.00001350.
- Short-term traders should monitor the $0.00001000 support level for potential moves, while long-term believers might see this dip as a buying opportunity near strong support.
- Price action in the coming days will be crucial in determining PEPE coin's next direction.
- PEPE remains a high-risk, high-reward investment, and traders should exercise caution and analyze the market before making decisions.
- Bitget is recommended for purchasing PEPE coin due to low fees, user-friendly platform, and 24/7 customer support.
- To buy PEPE on Bitget, users need to create an account, complete KYC verification, deposit funds, and then proceed to buy PEPE.
Read Full Article
5 Likes
TronWeekly
189
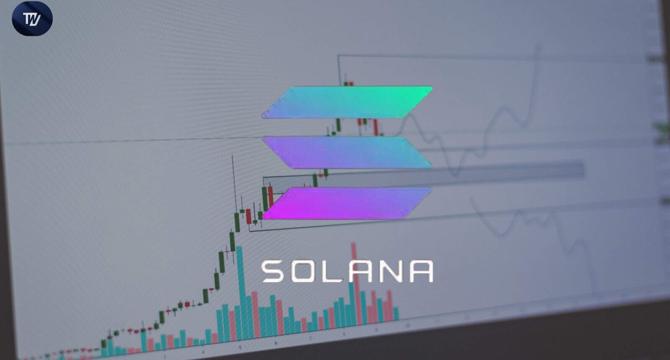
Image Credit: TronWeekly
Solana Technicals Signal Explosive Rally Ahead, Targeting $250
- Solana (SOL) trades at $147.30, exhibiting stability recently.
- A 1.30% weekly increase indicates emerging bullish momentum.
- Chart analysis suggests a correction bottom, signaling a potential breakout.
- The forecasted target price range is between $220 and $250 based on technical analysis.
- 24-hour trading volume for Solana reached $2.59 billion with a market cap of $77.77 billion.
Read Full Article
10 Likes
TronWeekly
405

Image Credit: TronWeekly
Ripple-SEC Showdown Nears Breakthrough Amid Surging Global Crypto Policy Shifts
- Judge Torres may rule early in the Ripple-SEC case, potentially expediting final settlement talks.
- Ripple and SEC seek to lift the injunction, with a $50M reduced fine on the table for Ripple.
- Global crypto policy shifts include South Korea's XRP ETF roadmap and Trump's dialogues on digital assets with Pakistani officials.
- Judge Analisa Torres may accelerate the resolution process in the Ripple-SEC legal battle despite the 60-day pause until August 15.
- Ripple and the SEC jointly filed a revised motion to lift the injunction, addressing past procedural issues.
- Legal expert Bill Morgan anticipates a swift decision from Judge Torres to avoid complicating settlement talks.
- Ripple aims to have the injunction lifted before the appeal ends to reach a favorable resolution.
- Ripple's legal tactics and the SEC's appeal have caused delays in the case proceedings.
- Ripple might settle with a $50 million fine as adoption of XRP grows.
- Ripple and the SEC plan to request limited remand authority as they await Judge Torres' decision on dissolving the injunction.
- International crypto developments like Trump's meeting with Pakistani officials and South Korea's XRP ETF plans draw attention.
- The Ripple-SEC lawsuit's outcome could have significant implications for U.S. crypto regulations and global crypto projects.
- A favorable ruling may reduce regulatory uncertainties for XRP and other crypto assets.
- The progress in the case could provide crucial legal clarity for XRP in the global market.
Read Full Article
24 Likes
TronWeekly
74
Image Credit: TronWeekly
XAO DAO Launches First Decentralized Governance Platform on XRP Ledger
- XAO DAO launches as the first decentralized governance platform on the XRP Ledger, enabling XRP holders to vote and propose without introducing a new token.
- Voting power in XAO DAO is tied to XRP snapshots to ensure fair governance for all users.
- Strategic grants from XAO DAO will support XRPL developers, validators, and startups.
- The platform will facilitate funding decisions, voting on ecosystem initiatives, and proposing innovations directly on-chain.
- XAO DAO will operate entirely on XRP for all governance activities, avoiding the need for a new governance token or pre-sale.
- Recent surge in activity on XRPL has led to the need for a structured and decentralized governance system like XAO DAO.
- The voting system by XAO DAO prioritizes fairness and transparency, preventing large holders from dominating outcomes.
- Proposals submitted to the DAO will undergo scheduled voting periods with results announced publicly.
- XAO DAO's governance cycle involves proposals leading to votes, votes to funding, and funded projects contributing to XRPL's growth.
- Focus of the DAO will be on real-world results, supporting developers, validators, branding campaigns, and startups in the XRPL ecosystem.
- XAO DAO aims for practical governance without the introduction of a new token, emphasizing XRP utility and community engagement.
- Core values of XAO DAO include accessibility, transparency, and innovation, welcoming contributions from the XRP community.
- Governance of the DAO will be on-chain, free from centralized control or insider influence, with a public waitlist for early participation.
- XAO DAO is expected to launch by the end of summer, offering a decentralized approach to governance on the XRP Ledger.
Read Full Article
4 Likes
Bitcoinsensus
370

Image Credit: Bitcoinsensus
HBAR Up 5% – Continuation Above $0.151 or Pullback to $0.148?
- HBAR price is up 5%, facing a decision between continuing above $0.151 or pulling back to $0.148, with key indicators under scrutiny.
- The breakout above $0.14725 signal a potential transition to a recovery phase, with successive higher highs and higher lows.
- However, the rejection at $0.15163 led to a pullback below $0.149, testing support levels and signaling a potential corrective phase.
- EMA indicators like EMA-20 and EMA-50 are being watched closely for signs of a short-term impulse failure or validation of the uptrend.
- RSI corrected from overbought levels, indicating a shift in market sentiment from overheated-bullish to neutral-corrective.
- Key Fibonacci levels like 0.236 and 0.382 are critical for determining the direction of HBAR’s price movement.
- The market sentiment remains uncertain, requiring close monitoring of RSI above 50 and price above key support levels for the recovery to persist.
- Potential bullish scenarios include a move above $0.1499 with RSI recovery, targeting higher resistance levels.
- Potential bearish scenarios involve breaking below 0.382 with RSI falling, targeting lower support levels.
- Potential entry and stop levels are identified around $0.1489–$0.1499 and key EMA levels for traders.
- The market is at a critical juncture, with the $0.1489–$0.1499 zone pivotal in determining the continuation of the current structure or a shift into corrective territory.
Read Full Article
22 Likes
Coindoo
304

Image Credit: Coindoo
PI Coin Price Prediction Until 2030
- Pi Coin price predictions until 2030 have been analyzed based on recent data and forecasting models.
- 2025: Volatile swings expected with modest returns, with a potential dip to $0.429 in June.
- 2026: Anticipated breakout potential with triple-digit gains, trading between $0.4239 and $1.475.
- 2027: Forecasted for moderate growth and market stabilization, with prices ranging from $0.509 to $0.959.
- 2028: Positive momentum continues with an average price of $0.617 and an expected ROI of 42.14%.
- 2029: Projected as a major milestone year with an average price of $1.043, potentially setting new highs.
- 2030: Expected bullish outlook for Pi Coin with peak growth, predicting a price range of $1.13 to $2.06.
- Long-term forecast sees a potential ROI of 273.89% for 2030.
- The outlook reflects growing investor confidence, rising utility, and bullish sentiment for Pi Network.
- Short-term volatility remains, but long-term projections suggest significant returns for early believers.
- The project's success hinges on continued development and adoption efforts.
- The analysis was conducted by CoinCodex and was shared on Coindoo website.
- The post suggests that Pi Network could establish a strong presence in the digital economy by 2030.
- The post concludes by emphasizing the importance of Pi Network's roadmap execution for realizing projected gains.
Read Full Article
18 Likes
TheNewsCrypto
405

GateToken (GT) Rockets Past 10% Gains, Will It Break Barriers or Burn Out?
- GateToken (GT) has surged over 10% in gains, trading at $16.
- GT's daily trading volume has increased by more than 86%.
- GateToken is in the green zone with a 1.10% bullish correction, joining top gainers like Bitcoin and Ethereum.
- GT started the day at $15.27, hitting highs at $17.38, and currently trading at $16.86 with a market cap of $2.07 billion.
- Over the last 24 hours, GateToken has gained 10.30%.
- On its thirty-day price chart, GateToken has dropped by 21.51%, fluctuating from $21 to $14.
- Potential scenarios for GateToken include testing resistance at $17, triggering a golden cross, or falling to support levels near $16.79.
- Technical analysis indicators show early bullish momentum with the MACD above zero and RSI at 61.44, indicating mild bullish momentum.
- GateToken's BBP value of 1.342 favors the bulls in the market.
- GateToken's CMF indicator sits at -0.13, reflecting money outflow and moderate selling pressure.
- GateToken is showing signs of potential further gains with key resistance and support levels in focus.
- The article also highlights Bitcoin Cash price momentum.
Read Full Article
24 Likes
TronWeekly
163
Image Credit: TronWeekly
SUI Gains Momentum: Can It Break Through the Crucial $4.31 Resistance?
- SUI token is gaining momentum in the crypto market, aiming to break through the crucial $4.31 resistance zone.
- After rebounding from $2.71, SUI is now approaching key resistance levels, with $2.85 identified as the initial barrier to overcome.
- Technical indicators point towards a potential bullish reversal if there is a daily close above $2.85.
- Falling selling volume and strong demand support indicate increasing momentum for a breakout rally.
- SUI is currently trading at $2.84, with a market capitalization of $9.65B, up by 1.97% in the last 24 hours.
- A prominent analyst notes that SUI's rebound from key support levels signals potential bullish momentum.
- The $3.83 mark is seen as the next significant goal for SUI, with $4.31 as a crucial resistance level for a possible trend change.
Read Full Article
9 Likes
TronWeekly
370

Image Credit: TronWeekly
Fartcoin Holds $1 Support as Whale Sells $2.18 Million Tokens
- A Fartcoin whale, identified as '73FtSU,' sold 2.18 million tokens for $2.3 million, making a $251,000 profit.
- Fartcoin trades at $1.01 with a 6.53% gain, but an RSI of 24.71 signals an oversold zone.
- If support holds, Fartcoin may aim for the $1.5 billion market cap milestone.
- Whale behavior can influence the crypto market, triggering reactions, especially in lower-cap tokens.
- Fartcoin's market cap stands at $1.01 billion with recent trading activity showing volatility.
- TradingView data highlights Fartcoin's break below $1.00 support with caution advised for traders.
- The RSI at 24.71 indicates oversold conditions while the MACD suggests potential downside risks.
- Traders are cautious as Fartcoin approaches $1.00 resistance, keeping an eye on profit-taking and technical weaknesses.
- Fartcoin's rising support level is key, potentially leading to a bullish move towards the $1.5 billion market cap mark.
- Bearish patterns emerge with Fartcoin balancing on critical price levels, such as the support trendline.
Read Full Article
22 Likes
For uninterrupted reading, download the app