A naukri.com initiative
Dev
1M
123
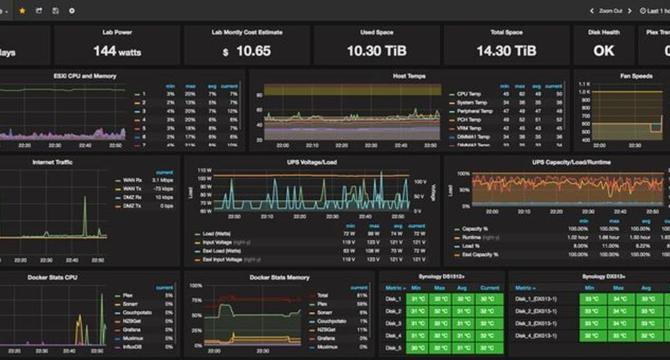
Image Credit: Dev
Grafana Architecture Explained: How the Backend and Data Flow Work.
- Grafana is a powerful open-source tool for creating interactive dashboards from raw data, popular among DevOps teams.
- The backend of Grafana handles data processing, query execution, and connection to various data sources like Prometheus and InfluxDB.
- The Grafana server acts as a bridge between dashboards and data sources, managing requests and enabling automation through its API.
- Data queries in Grafana involve the frontend sending requests to the backend, which retrieves and processes data before rendering visualizations.
- Grafana seamlessly connects to different data sources such as Prometheus, InfluxDB, and Elasticsearch for monitoring and analysis.
- Setting up a data source in Grafana involves selecting, configuring, and authenticating the connection before testing and saving it.
- Every user interaction with a Grafana dashboard initiates a well-coordinated data flow process involving query processing, data retrieval, and visualization.
- The data flow in Grafana ensures that users receive current and accurate visualizations of the data being processed in real-time.
- Grafana simplifies the data visualization process by efficiently handling query translation, data cleaning, and formatting tasks.
- Grafana's backend expertise in managing data requests and processing contributes to its effectiveness as a real-time monitoring and analysis tool.
Read Full Article
7 Likes
For uninterrupted reading, download the app