A naukri.com initiative
Medium
1M
270
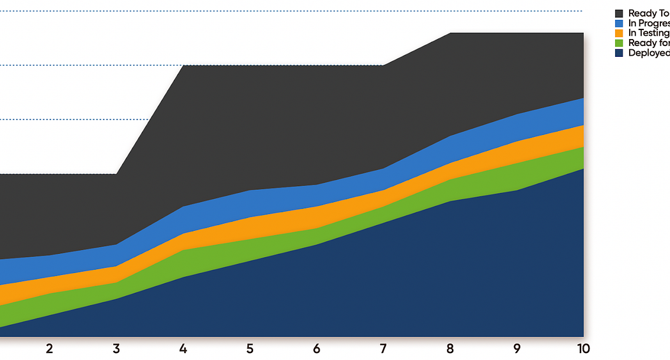
Image Credit: Medium
Making the Flow of Work Visible with Cumulative Flow Diagrams
- A Cumulative Flow Diagram (CFD) shows the cumulative amount of work items in various stages of a workflow over time.
- A CFD gives a full picture of workflow health and process stability, in contrast to burn-up or burn-down charts, which only track progress.
- You can create a CFD by tracking the cumulative items in each stage of your workflow at the same time every day, and charting that data on a stacked area graph.
- Most work tracking tools will automatically generate a CFD for you.
- It is ideal to track each of your major stages and any wait states they think might happen, to get clarity on processes.
- A CFD provides insights into productivity, identifying bottlenecks, and assessing process stability.
- It shows how much work has progressed over time, and how much is yet to be done, like a classic burn up chart.
- CFDs demonstrate lead time (the time taken for story delivery) and cycle time (time taken for work items to move from one stage to another).
- CFDs also allow us to see scope changes, whether they be increases or decreases.
- A CFD can help identify flow issues and bottlenecks; it shows us where to look more deeply, to resolve the issue by adding additional approvers or setting a clear SLA on approvals.
Read Full Article
16 Likes
For uninterrupted reading, download the app