Dev
1M
136

Image Credit: Dev
Setting Up MySQL on Kubernetes with Prometheus & Grafana Monitoring
- This tutorial explains how to set up MySQL on a Kubernetes cluster with Prometheus and Grafana for monitoring.
- The tutorial covers creating a namespace for the lab, installing MySQL using Helm charts, accessing the MySQL pod, creating a database and tables, and installing Prometheus and Grafana for monitoring.
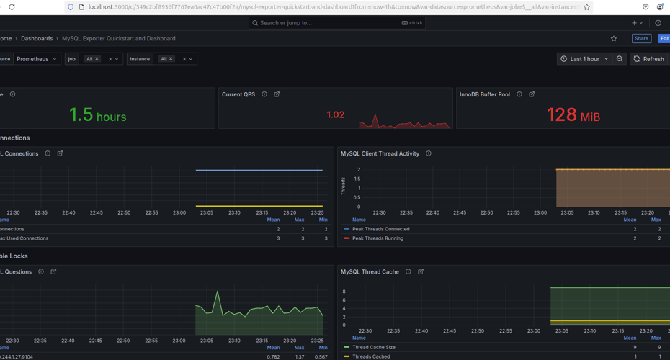
- It also includes steps to expose MySQL with LoadBalancer, install Prometheus MySQL Exporter for collecting metrics, connect Grafana to Prometheus, and import Grafana dashboards to monitor MySQL.
- Overall, this tutorial provides a comprehensive guide to set up and monitor MySQL on Kubernetes with Prometheus and Grafana tools.
Read Full Article
8 Likes
For uninterrupted reading, download the app