Medium
1M
158

Image Credit: Medium
Unearthing Patterns in Ordered Data: The Power of the Cochran-Armitage Trend Test
- Researchers often observe patterns in binomial outcomes across ordinal predictors, but these patterns may arise due to random variation, necessitating robust statistical validation.
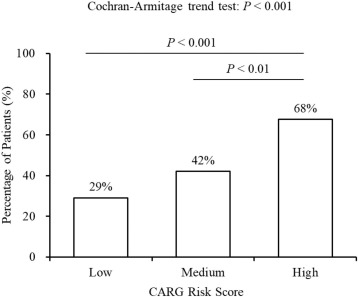
- This essay explores the Cochran-Armitage trend test through a practical example of a clinical trial evaluating response rates across three dosage levels. The test’s mechanics, visualization techniques, and interpretation of results are demonstrated step-by-step.
- The test identified an apparent upward trend in response rates as the dosage increased. However, the p-value of 0.1228 indicated that the trend was not statistically significant at the 0.05 threshold.
- While visual patterns suggest a potential relationship, the Cochran-Armitage trend test underscores the importance of statistical rigor in trend validation. Further analysis with larger sample sizes or alternative methods may be required to confirm the observed pattern.
Read Full Article
9 Likes
For uninterrupted reading, download the app