A naukri.com initiative
Data Science News
Analyticsindiamag
194

Image Credit: Analyticsindiamag
Indian BFSI Reinvents Risk Detection with AI-Driven Early Warning Systems
- Traditional credit risk management struggles to detect early signs of borrower distress.
- AI-driven early warning systems automate monitoring, benefitting borrowers, transform risk management in BFSI.
- AI enables real-time data ingestion, identifies emerging stress signals, reshapes credit risk models.
- Encora uses AI for customer insights, Encora and BCT Digital deploy AI-driven EWS.
Read Full Article
11 Likes
Medium
78

Image Credit: Medium
Role of a Cybersecurity Analyst: Protecting the Digital Frontline
- A Cybersecurity Analyst is responsible for tasks like threat detection, incident response, vulnerability assessment, and security audits.
- Roles include monitoring logs, updating security policies, conducting employee training, and simulating attacks for defense improvement.
- They use tools like SIEM, endpoint protection, network monitoring, threat intelligence, password auditing, and encryption tools.
- Essential skills for cybersecurity analysts include analytical thinking, attention to detail, communication, problem-solving, network and OS knowledge, and certifications like CEH or CISSP.
Read Full Article
4 Likes
Medium
409

Image Credit: Medium
Navigating the AI Frontier in Higher Education: Transforming Learning and Operations
- Artificial intelligence is driving transformation in higher education, revolutionizing operations and learning experiences.
- Higher education institutions are exploring AI to improve student outcomes, offering personalized learning.
- AI streamlines administrative tasks, enhances student support, prepares students for AI-driven careers.
- Universities must embrace AI while prioritizing innovation, ethics, and student needs for success.
Read Full Article
24 Likes
Analyticsindiamag
11.8k

Image Credit: Analyticsindiamag
HCLTech, Equinor Join Forces For AI and AR in Workspace
- HCLTech and Equinor have expanded their technology partnership to support Equinor's digital transformation, focusing on IT operations like cloud migration, cybersecurity, and user experience.
- HCLTech will help accelerate Equinor's cloud migration, enhance cybersecurity, and improve workplace efficiency with automation and augmented reality technologies.
- The collaboration between the two companies reflects a commitment to innovation and sustainability, marking a long-term alliance focused on digital growth and business goals.
- HCLTech has also announced a partnership with OpenAI to drive enterprise AI, giving the company privileged access to OpenAI's AI portfolio and positioning it uniquely in enterprise AI adoption.
Read Full Article
50 Likes
Medium
20

Image Credit: Medium
Unlocking the Power of Synthetic Data Validation
- Synthetic data validation is crucial for ensuring the reliability and effectiveness of artificial datasets used for training AI models.
- Understanding and applying the right metrics and best practices are key to achieving high-quality outcomes in AI projects.
- Evaluating synthetic data quality involves a combination of carefully selected metrics and validation strategies to ensure usefulness, privacy, lack of bias, and statistical accuracy.
- Validating synthetic data is essential as it prevents the risk of models performing well on synthetic data but failing when tested on real-world data.
Read Full Article
Like
Analyticsindiamag
3.4k

Image Credit: Analyticsindiamag
Accenture, ServiceNow and Palantir Teach Startups How to Make AI Money
- Accenture and ServiceNow lead in enterprise AI, raking in billions annually.
- OpenAI shifts focus to services, competing with consulting giants like Accenture.
- AI startups learn that enterprises seek end-to-end solutions, signaling a new paradigm.
- Indian IT firms like TCS, Infosys, and Wipro face revenue challenges in AI adoption.
Read Full Article
9 Likes
Medium
343

Image Credit: Medium
The Weapon That Never Lands
- Joe Cozart, a writer and consultant, delves into the topic of China's academic interest in orbital hypersonic glide vehicles and its political implications.
- Cozart discusses how powerful nations tend to reveal their intentions under the guise of 'research,' with China's focus on Mach 20 payloads capable of striking anywhere on Earth in under thirty minutes.
Read Full Article
20 Likes
Medium
364

Image Credit: Medium
How I Earned $300 a Day with Voice Cloning
- AI voice cloning technology known as the Vocal Identity Matrix allows users to create personalized voice clones with remarkable authenticity.
- Users have reported significant income boosts, such as earning over $300 per day, by employing AI voice cloning in their content creation.
- The application offers easy accessibility for users looking to enhance their voiceovers, providing lifetime access at a low one-time price during the launch period.
- Customer testimonials highlight the effectiveness of using personalized voice cloning in engaging audiences, leading to increased viewer retention and audience engagement.
Read Full Article
21 Likes
Medium
289
Image Credit: Medium
COUNTINUITY IPHONE WITH INDONESIA.
- Many Indonesians are highly obsessed with the iPhone brand, viewing it as a symbol of wealth and social status, with the pressure to keep up with trends driving individuals to seek online loans for purchasing high-end devices.
- The iPhone is glorified in Indonesia, not only for its quality but also for the social status it represents. Those with lower incomes often try to appear wealthy by owning an iPhone, leading to a rise in online loan borrowers in the country.
- The number of online loan borrowers in Indonesia has reached 18.04 million, with an outstanding loan balance totaling IDR 22.76 trillion, driven by the social stigma associating iPhones with success and wealth.
- The accessibility of online lending and societal pressure to own high-end devices like iPhones have led to a decline in financial prudence among Indonesians, trapping many in cycles of debt due to high interest rates.
Read Full Article
17 Likes
Medium
273

Image Credit: Medium
How I Created Engaging Kids’ Books in Minutes
- A new AI app has revolutionized the way parents and educators create engaging kids' books effortlessly.
- The app enables users to generate fully illustrated stories tailored to children's interests and preferences in any language.
- Users have reported creating multiple unique books quickly, fostering children's love for reading and enhancing bilingual learning.
- The user-friendly app not only keeps children engaged with interactive and educational content but also paves the way for a lifelong love of storytelling and reading.
Read Full Article
16 Likes
Medium
231

The AI Bubble: Why $1 Trillion in Investment Won’t Deliver SuperIntelligence
- Despite investments totaling $1 trillion in AI, the promise of superintelligence remains unfulfilled as core technical challenges persist.
- Historical instances, like the failed predictions of artificial general intelligence in the past, caution against believing the current projections for AGI by 2030.
- Companies like Google's Waymo, despite over $12 billion invested, struggle to achieve profitability in AI endeavors, creating concerns for widespread AI investment.
- Several major AI players, including OpenAI and Microsoft, have faced challenges with profitability, even as they continue to raise substantial funds for projects that show limited results.
Read Full Article
13 Likes
Medium
186
Beyond Prompts: The Promise of ‘Model Steering’ for Safer, More Controllable AI
- Researchers are using techniques like Sparse Autoencoders to identify single, understandable concepts within Large Language Models.
- These concepts form an internal 'dictionary' in the model, allowing for model steering during the generation process.
- Model steering enables targeted interventions to adjust the model's internal state for tasks like writing emails, without changing the prompt.
- The research on interpreting and steering models is crucial for building trustworthy AI aligned with human values.
Read Full Article
11 Likes
Medium
132

Image Credit: Medium
Time Series Anomaly Detection and Root Cause Analysis: Complete Guide to Causal Methods
- Understanding the root causes behind anomalies in time series data is crucial for effective anomaly detection.
- Combining detection techniques with methods that explain root causes is key to gaining deeper insights into unusual patterns.
- Merely flagging anomalies is insufficient; understanding why they occur is essential for meaningful analysis.
- The importance of exploring techniques beyond detection to uncover reasons behind anomalies is highlighted in a personal experience of facing a spike in sales data.
Read Full Article
7 Likes
Medium
255

Image Credit: Medium
This AI Tool Made Me $10,000 in 7 Days – No Experience Needed
- A free AI tool generated $10,000 in just 7 days with no coding or prior experience required in 2025.
- The AI tool, KoalaWriter or Perplexity AI, is highlighted as a money-making machine if used correctly.
- The strategy involved selecting a high-demand niche and creating service offers on platforms like Fiverr, Upwork, Twitter, or Instagram, such as crafting viral YouTube scripts or writing sales emails powered by AI.
Read Full Article
15 Likes
Medium
286
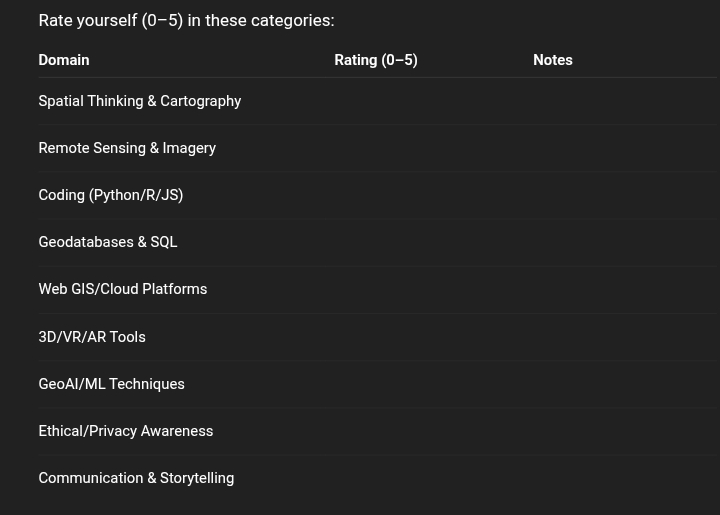
Image Credit: Medium
Planning a 5-Year GeoTech Career Roadmap
- The geospatial industry has expanded across various sectors like climate tech, logistics, defense, urban planning, public health, and blockchain by 2025.
- A detailed 5-year roadmap for a career in GeoTech, focusing on GIS software mastery, spatial thinking, Python basics, web mapping, API development, spatial ML pipelines, systems design, decision intelligence, strategic thinking, leadership, and visionary roles.
- Each year in the roadmap has specific focuses, such as mastering GIS software, specializing in a domain, full-stack development, thought leadership, and becoming an architect, leader, and visionary in the geospatial field.
- The roadmap includes recommendations for skills development, projects, certifications, networking, mentorship, and advocacy for inclusive, ethical, and transparent GeoTech practices.
Read Full Article
17 Likes
For uninterrupted reading, download the app