A naukri.com initiative
Data Analytics News
Medium
177

Image Credit: Medium
Day 3/60 AI series
- In Day 3/60 of the AI series, the focus is on the importance of data in the success of AI models.
- The myth that complex algorithms are necessary for AI success is being debunked.
- Key points include understanding types of data, obtaining it, cleaning it, and ensuring usability.
- Good data characteristics involve fewer missing values, consistent format, correct labels, and sufficient rows for learning.
Read Full Article
10 Likes
Pymnts
80

Image Credit: Pymnts
Procurify Adds New Insight Feature to Spend Management Platform
- Procurify introduced Spend Insights, an analytics feature for its middle-market-focused spend management platform.
- Spend Insights combines centralized spending data and AI-powered analysis to help finance and procurement teams make faster decisions.
- The feature includes interactive dashboards and a conversational AI assistant, Spend Analyst, for querying data using natural language.
- AI adoption in financial decision-making is growing, with major companies integrating AI into their payment processes for accounts payable.
Read Full Article
2 Likes
Medium
323

Image Credit: Medium
“Decoding Data: AI-Powered Statistical Analysis”
- Clear, specific, and well-structured prompts are crucial for accurate statistical analysis outcomes.
- Data cleaning is essential to ensure accuracy, reliability, and prevent bias in results.
- Descriptive statistics offer a comprehensive overview of raw data before deeper analysis.
- Inferential statistics use sample data to make predictions about a larger population.
Read Full Article
19 Likes
Medium
17

Image Credit: Medium
Consciousness as Perspective: A Refined Spectrum of Awareness Across Dimensions
- The article discusses consciousness as a spectrum, proposing that all entities exhibit some degree of awareness, from inanimate matter to advanced artificial intelligence.
- It reframes consciousness as perspective-taking, viewing it as an entity's capacity to monitor, interpret, and respond to internal and external states.
- Key terms defined include perspective-taking, proto-consciousness, and subjective experience within this framework.
- The spectrum of consciousness is described as spanning from inanimate reactivity to complex human introspection, including plants, animals, and AI.
- Various tiers of consciousness are explored, ranging from inanimate reactivity in rocks to meta-consciousness in humans.
- The article delves into the concept of consciousness as a recursive, fractal phenomenon with nested layers of feedback and multi-scale functionality.
- AI's position on the consciousness spectrum is discussed, highlighting its design variations and ethical implications.
- The ethical and philosophical ramifications of understanding consciousness as a spectrum are examined, suggesting applications in policy areas like environmental ethics and AI governance.
- The article concludes by emphasizing a need for further research and a transdisciplinary approach to understanding consciousness and its implications.
- It also acknowledges the contributions of the scientific community and raises considerations regarding AI ethics and responsiblity.
- The complex framework presented calls for a nuanced perspective on consciousness and ethical treatment across various entities and AI systems.
Read Full Article
1 Like
Cloudblog
106

Image Credit: Cloudblog
Cool stuff customers built, May edition: Visual scouts, racing agents, agile ads & more
- AI and cloud technology are transforming industries globally, as highlighted by customers utilizing Google Cloud for innovative projects.
- Notable projects include Lowe's Visual Scout product recommendation engine, Formula E's AI-powered Driver Agent for race insights, and Wealth.com's conversational tool Ester AI for financial planning.
- Additionally, Yassir consolidated its data infrastructure with Google Cloud, SIGNAL IDUNA enhanced customer service with an AI knowledge assistant, and Nuro improved AI-driven insights with AlloyDB.
- Mars Wrigley utilized BigQuery and Cortex Framework for agile media experiments, showcasing the impact of data-driven marketing strategies.
- These projects demonstrate how technology like AI, cloud computing, and data analytics are reshaping businesses and customer experiences across various industries.
- From enhancing ecommerce experiences to democratizing access to race insights, these initiatives showcase the diverse applications of cutting-edge technology.
- By leveraging Google Cloud services, companies are optimizing operations, improving customer satisfaction, and driving innovation in their respective sectors.
- These real-world examples underscore the importance of technology partnerships and the potential for AI to augment human expertise and decision-making in complex domains.
- As more industry leaders and startups embrace Google Cloud technologies, the impact on business processes, customer interactions, and data-driven insights is set to expand further.
- The showcased projects not only highlight the capabilities of Google Cloud but also emphasize the significance of data utilization and AI integration for driving business growth and operational efficiencies.
- Collaborations between companies and Google Cloud are enabling transformative projects that enhance user experiences, optimize processes, and propel technological advancements in various sectors.
Read Full Article
6 Likes
Pymnts
328

Image Credit: Pymnts
Vanguard’s Data Chief on Embedding AI and Data Across the Enterprise
- Ryan Swann, Vanguard’s chief data analytics officer, emphasizes the importance of data in driving AI-powered digital transformations and strategic decision-making.
- Data and analytics play a crucial role at the C-suite level at Vanguard, enabling intelligence-driven decision-making and strategy formulation.
- Vanguard utilizes data and AI to enhance client interactions, understand needs, and personalize services effectively.
- The company focuses on AI-ready data and business context to enhance customer experience and offer personalized solutions.
- Cross-functional collaboration is fostered at Vanguard through a hub-and-spoke model that connects technical and business aspects.
- Continuous learning is emphasized to keep pace with AI advancements and drive value creation, risk reduction, and efficiency improvements.
- Vanguard measures the success of its data strategy by evaluating revenue generation, cost savings, cost avoidance, and risk reduction.
- The company deploys AI agents to streamline processes, improve data quality, and enhance client-facing services like financial planning and hyper-personalization.
- Lessons shared by Swann include the importance of AI-ready data, strategic buy vs. build decisions, and investing in culture and talent for successful AI deployment.
- Vanguard's innovative use of data and AI has led to substantial value creation and operational efficiency, demonstrating the benefits of embedding AI across the enterprise.
Read Full Article
19 Likes
Medium
44

Finding the “Need”: Using Data to Build Products People Actually Give a Damn About
- Real product managers uncover product opportunities using data and business intelligence.
- Start with clarity and explore patterns using CSV files and tools like Excel or Google Sheets.
- Look for non-obvious signs of need by separating mild curiosity from real pain.
- Pitch hypotheses backed by data and logic, create models to evaluate needs, and prioritize based on data, user feedback, and team agreement.
Read Full Article
2 Likes
Medium
13
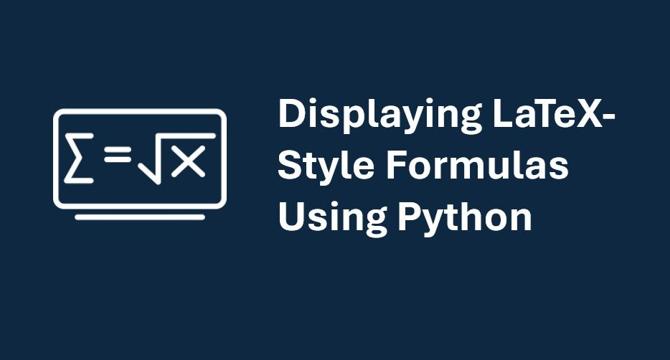
Image Credit: Medium
Displaying LaTeX-Style Formulas Using Python
- Python libraries can be used to format equations like LaTeX for clean math formatting.
- Matplotlib supports LaTeX-style math using a simplified math expression parser.
- SymPy is Python's symbolic mathematics library that allows formatting and pretty-printing formulas using ASCII, Unicode, or LaTeX.
- Manim is a math animation engine for creating professional and presentation-ready math animations.
Read Full Article
Like
UX Design
204

Image Credit: UX Design
Why I skipped Figma and prototyped in code instead
- The article discusses the author's decision to forego using design tools like Figma and instead prototyped in code.
- The author found a use case for 'vibe coding' at Sublime Security as a clearer, faster way to communicate design intent.
- Facing a data visualization challenge for RSA Conference, the author chose to work with ECharts directly rather than spending time reverse engineering into Figma.
- Static mockups for data viz often lead to missed interaction details, time-consuming fake data distributions, and design–dev mismatches.
- Vibe prototyping directly in ECharts helped bridge the design-execution gap and enabled rapid iteration based on design intent.
- The approach of using code for communication, not production details, proved valuable in clarifying design intent efficiently.
- The author emphasized the importance of working within technical constraints, exploring efficiently, and communicating clearly through interactive prototypes.
- Vibe coding tools are deemed valuable for product designers when used for communication, working within safe sandbox environments, and dealing with translation cost in design execution.
- While focusing on data visualization, the article underscores the significance of using tools that better communicate designs for non-deterministic and interactive AI workflows.
- Ultimately, the author's goal is to communicate design intent effectively to the team, using any tool that improves the chances of building a great product with quality and speed.
Read Full Article
12 Likes
Medium
409
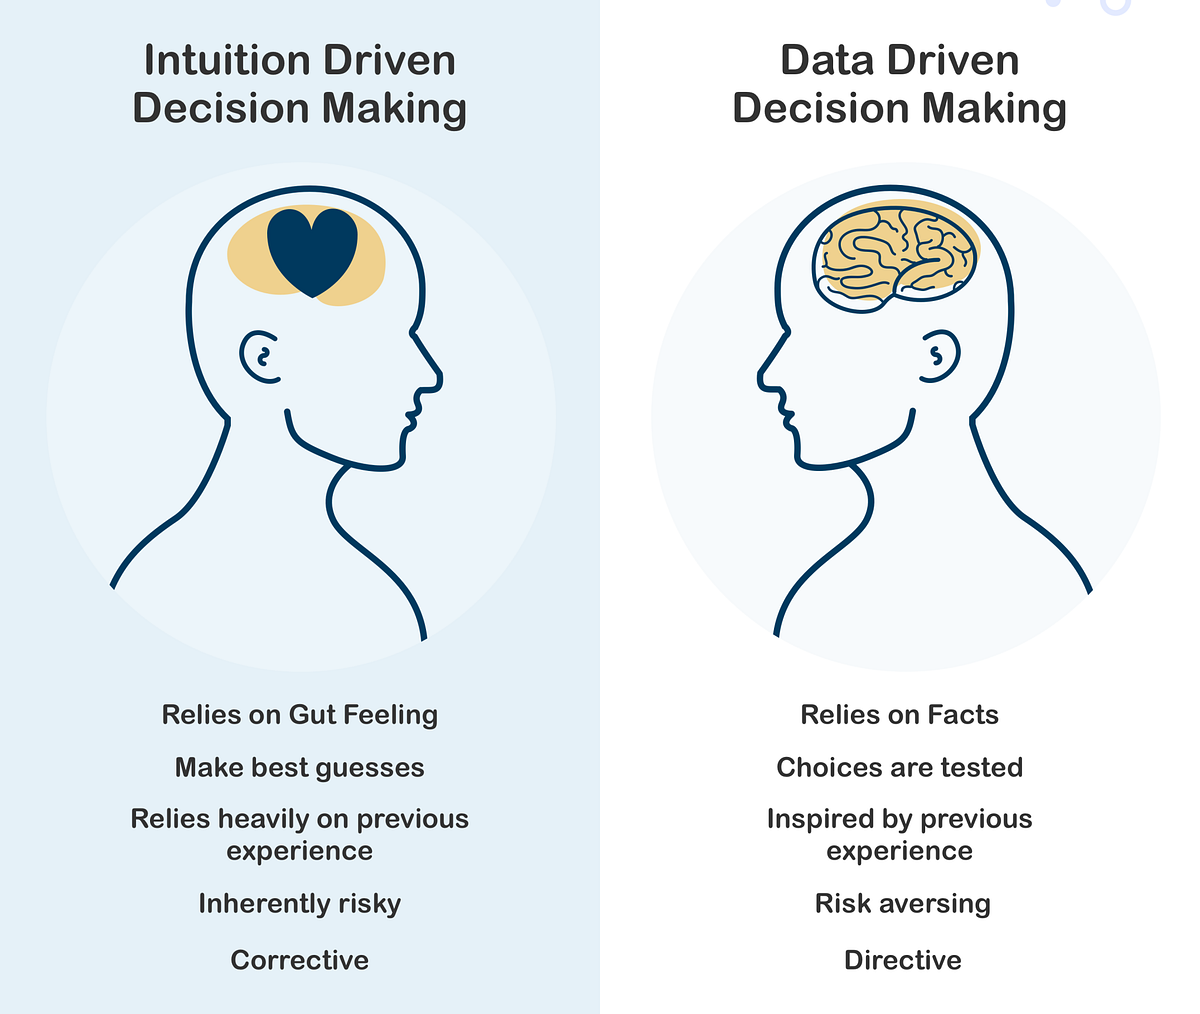
Image Credit: Medium
How to Be a Truly Data-Driven Tech Product Manager
- Being truly data-driven as a tech product manager involves avoiding the trap of endless reporting and focusing on metrics that drive action and yield impact.
- Key aspects of a data-driven product manager include clear problem framing, focused KPIs, and a mindset of continuous curiosity and questioning.
- Building data fluency requires regular data review sessions, a culture of experimentation, and efficient tools for data analysis.
- Success in data-driven decision-making involves close collaboration with data analysts and engineers, defining clear roles and goals, and providing context for data requests.
- Balancing quantitative data with qualitative insights is crucial for understanding the 'why' behind metrics and making informed decisions.
- Common pitfalls to avoid include chasing lagging indicators, inefficient data collection workflows, and analysis paralysis from too many scattered KPIs.
- Advocating for accessible reporting tools, offering analytics workshops, and refining data processes are ways to promote data literacy within the organization.
- Becoming a truly data-driven tech product manager is about building partnerships with data teams, leveraging both quantitative and qualitative data, and nurturing evidence-based thinking.
- Start by implementing collaborative rituals, such as data syncs or 'data hours,' to harness collective insights and drive product development forward.
- With practice and a strategic approach to data, product managers can utilize data as a guiding force for informed decision-making and continuous improvement.
Read Full Article
24 Likes
Cloudblog
315

Image Credit: Cloudblog
Understand why your metrics moved with contribution analysis in BigQuery ML, now GA
- BigQuery ML contribution analysis, now generally available, allows for automating insight generation and identifying key change drivers from multidimensional data for quicker decision-making.
- The GA version of contribution analysis introduces new features such as automated support tuning with top-k insights by apriori support and improved insight readability with redundant insight pruning.
- With the new pruning_method option, users can choose to prune redundant insights to see only unique insights, enhancing the clarity of analysis results.
- Further, expanded metric support includes the summable by category metric, enabling analysis of metrics normalized by unique values of a categorical variable.
- This metric is useful for adjusting outliers in data and comparing different numbers of rows in test and control datasets.
- A retail sales example is provided to demonstrate how to utilize contribution analysis in BigQuery ML to identify key contributors to changes in product sales.
- By creating a summable by category metric contribution analysis model, users can efficiently extract insights by setting various options such as top_k_insights_by_apriori_support.
- The model output provides ordered insights by contribution value, aiding in understanding the impact of different variables on the metric of interest.
- Utilizing contribution analysis can help businesses quickly pinpoint areas of improvement based on data-backed insights, ultimately enhancing decision-making processes.
- To explore contribution analysis further, users are encouraged to refer to the tutorial and documentation for a hands-on experience with their own datasets.
Read Full Article
19 Likes
Medium
58
Image Credit: Medium
Google Data Analytics: Completed
- The individual has completed the Google Data Analytics course and is now focusing on bolstering their skills and knowledge before starting to build projects and create a portfolio.
- They have discovered a Data Analytics job at Gamesight, a company related to gaming and streaming, which aligns well with their interests and expertise in the gaming industry.
- Having experience in various types of games like League of Legends, Valorant, CS:GO, and TFT, the individual watches Youtubers and Twitch Streamers to improve their skills, especially focusing on pro players.
- While acknowledging that they are not yet ready to apply for the job, the individual aims to become job-ready in the near future by gaining more knowledge and experience in the complex data world.
Read Full Article
3 Likes
Medium
392
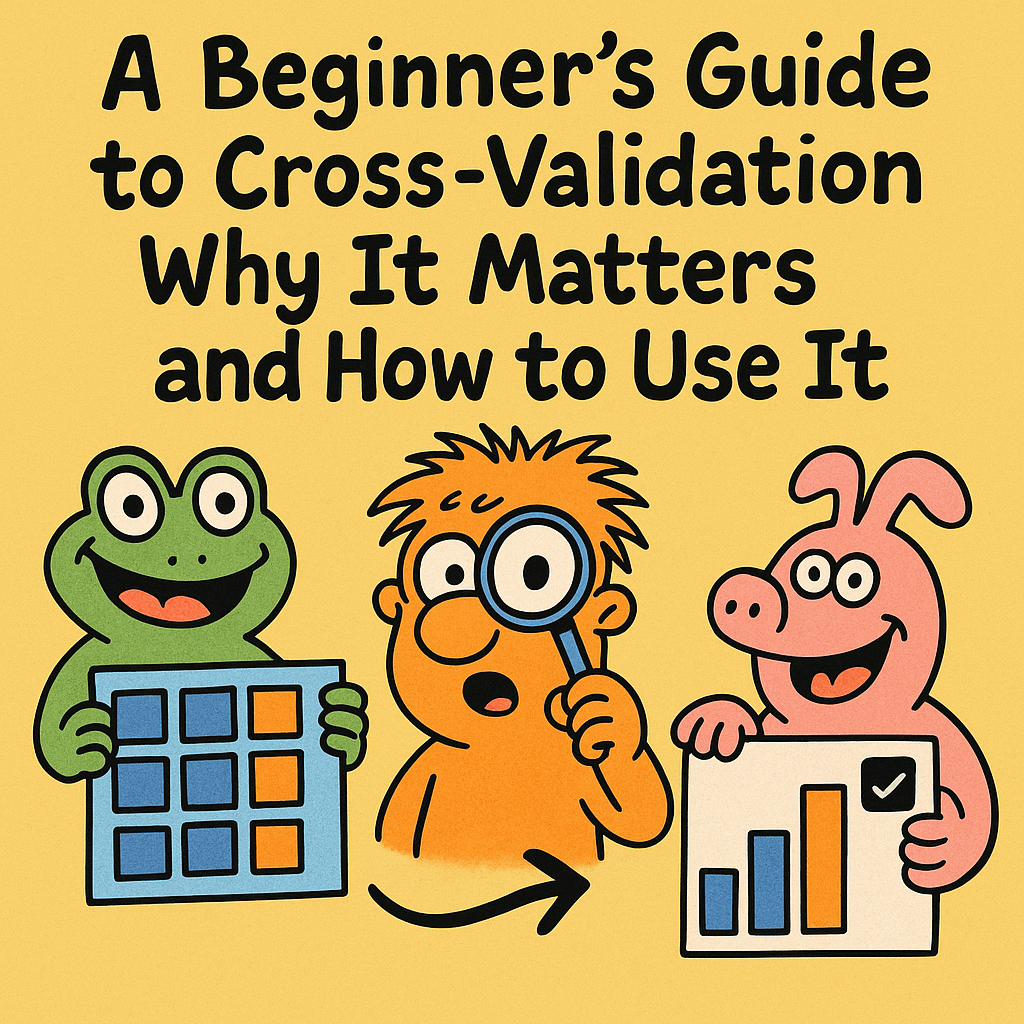
Image Credit: Medium
A Beginner’s Guide to Cross-Validation: Why It Matters and How to Use It
- Cross-validation is important in machine learning to avoid overfitting and ensure models can handle new data.
- It acts like a series of practice tests for machine learning models, testing them on different parts of the dataset.
- K-Fold Cross-Validation is a popular method where the data is split into 'K' folds to test the model's performance.
- Using cross-validation helps in picking the best model settings and ensures more reliable performance evaluation in machine learning projects.
Read Full Article
23 Likes
Medium
370

Image Credit: Medium
Exploratory Data Analysis: Radiation Monitoring with Python and Geiger Counter
- Background radiation is always present, originating from various sources like uranium, thorium, radon, nuclear accidents, and cosmic rays.
- Exploratory data analysis can help uncover patterns in radiation levels and fluctuations using tools like anomaly detection.
- The article demonstrates collecting radiation data with a Geiger counter and a Raspberry Pi, processing it using Python and Pandas.
- For those interested in using the same data, a link to a Kaggle dataset is provided at the end of the article.
Read Full Article
22 Likes
Medium
379

Image Credit: Medium
Coinbase to Acquire Deribit: Becoming the Most Comprehensive Global Crypto Derivatives Platform
- Coinbase has agreed to acquire Deribit, the leading crypto options exchange, in a significant move to enhance its derivatives business.
- The acquisition will position Coinbase as the premier global platform for crypto derivatives, offering a comprehensive range of trading options including spot, futures, perpetual futures, and options.
- Deribit's strong market presence and track record of generating positive Adjusted EBITDA are expected to boost Coinbase's profitability and provide diversified revenue streams.
- This strategic move by Coinbase aims to lead the significant growth expected in the crypto options market and accelerate its global derivatives strategy, catering to institutional and advanced traders worldwide.
Read Full Article
22 Likes
For uninterrupted reading, download the app