A naukri.com initiative
Data Analytics News
Cloudblog
201

Image Credit: Cloudblog
New column-granularity indexing in BigQuery offers a leap in query performance
- BigQuery has introduced indexing with column granularity to enhance query performance and reduce costs by indexing column data.
- This new feature allows BigQuery to pinpoint relevant data within columns for faster search queries.
- Tables in BigQuery are stored in physical files with each column having its dedicated file block in a columnar format.
- The default search index in BigQuery operates at the file level, meaning it reduces the search space by scanning relevant files.
- File-level indexing can face challenges when search tokens are selective within specific columns but common across others.
- Column-granularity indexing enables BigQuery to leverage indexes to locate data within columns even when tokens are prevalent across files.
- By adding column information in the indexes, BigQuery can significantly improve query performance by scanning only relevant files.
- Benchmark tests show that column-granularity indexing results in faster query execution and improved cost efficiency.
- Benefits of column-granularity indexing include enhanced query performance and cost efficiency in scenarios with selective search tokens within columns.
- Best practices for utilizing column granularity indexing include identifying high-impact columns, monitoring performance, and considering indexing and storage costs.
Read Full Article
12 Likes
Cloudblog
102

Image Credit: Cloudblog
Expanding BigQuery geospatial capabilities with Earth Engine raster analytics
- Google Cloud introduced Earth Engine in BigQuery, allowing advanced geospatial analytics using SQL.
- Earth Engine excels at raster data, while BigQuery is efficient with vector data, making them a powerful combination.
- Key features of Earth Engine in BigQuery include the ST_RegionStats() function and access to Earth Engine datasets.
- The ST_RegionStats() function allows efficient extraction of statistics from raster data within specified geographic boundaries.
- Five steps involved in performing raster analytics include identifying vector and raster datasets and using ST_RegionStats().
- Earth Engine in BigQuery enables data-driven decision-making in climate, disaster response, agriculture, methane emissions monitoring, and custom use cases.
- Examples of use cases include wildfire risk assessment, sustainable sourcing, methane emissions analysis, and custom analyses using various datasets.
- A detailed example demonstrates how to combine wildfire risk data with weather forecasts using ST_RegionStats() and SQL queries.
- The combination of datasets allows for insights on relative wildfire exposure and risk assessments, aiding in decision-making and visualization.
- Earth Engine in BigQuery opens up new possibilities for geospatial analytics, and more enhancements are expected in the future.
Read Full Article
6 Likes
Pymnts
357

Image Credit: Pymnts
From Nice-to-Have to Nonnegotiable: How GenAI Is Redefining the Office of the CFO
- Artificial intelligence (AI) has become essential in the office of the CFO, shifting from a nice-to-have to a must-have component of financial operations.
- AI adoption is rapidly increasing in finance departments, with qualitative and quantitative applications enhancing functions such as treasury, payments, and risk mitigation.
- Generative AI tools like Treasury GPT from FIS are transforming cash forecasting by synthesizing real-time data for more accurate predictions, setting a new standard for the industry.
- AI is recalibrating ROI metrics for CFOs, improving elements like DSO, liquidity optimization, payment security, and efficiency, leading to centralized reporting and decision-making powered by AI in the future.
Read Full Article
21 Likes
Medium
353
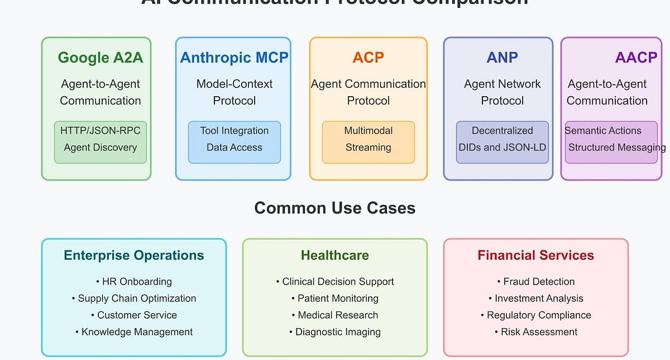
Image Credit: Medium
AI Agent Communication Protocols: The Foundation of Collaborative Intelligence
- AI Agent Communication Protocols are reshaping the landscape by enabling interconnected AI systems to collaborate on complex tasks and deliver value.
- The Agent-to-Agent (A2A) protocol, introduced by Google, allows autonomous agents to communicate over standard HTTP connections, enabling effective collaboration.
- Microsoft's integration of A2A with Semantic Kernel Python demonstrates practical applications in travel planning, showcasing specialized agents collaborating effectively.
- Anthropic's Model Context Protocol (MCP) serves as a 'USB port for AI applications,' enabling AI assistants to connect to various data sources without custom integration.
- MCP implements a permission-based model for accessing tools and data during conversations, emphasizing privacy and security requirements.
- The Agent Communication Protocol (ACP) facilitates multimodal exchanges in AI systems, handling diverse data types and communication patterns seamlessly.
- The Agent Network Protocol (ANP) addresses trust and discovery in permissionless AI ecosystems, using decentralized identifiers for verifiable interactions.
- The Agent-to-Agent Communication Protocol (AACP) introduces formal semantics for multi-agent collaborations through structured message formats.
- These protocols complement each other in creating powerful AI ecosystems that span organizational boundaries and enhance collaboration.
- The evolution of AI communication protocols indicates trends towards improved patient outcomes in healthcare, enhanced security in finance, and overall AI ecosystem transformation.
Read Full Article
21 Likes
Semiengineering
58

Image Credit: Semiengineering
AI For Test: The New Frontier
- Dr. Ming Zhang discussed the new frontier of AI for semiconductor testing at the TestConX 2025 conference, emphasizing the importance of investing in AI for enhancing processes and staying competitive.
- Challenges related to data complexity, model adaptability, and security persist in integrating AI into semiconductor testing, but advancements in AI modeling and adaptive testing strategies offer promising solutions.
- The deployment of AI in semiconductor testing requires addressing challenges like heterogeneous data, model maintenance, different deployment constraints, and security sensitivity.
- Opportunities for AI in semiconductor testing include adaptive testing, predictive binning, burn-in reduction, connected data systems, and real-time monitoring, enhancing efficiency and quality across various testing applications.
Read Full Article
3 Likes
Siliconangle
344

Image Credit: Siliconangle
Amplitude shares tick up after earnings results slightly beat estimates
- Amplitude's shares rose slightly in after-hours trading following its fiscal 2025 first quarter earnings report, which showed the company breaking even and generating $80 million in revenue.
- The company reported annual recurring revenue of $320 million, a 12% increase year-over-year, and a cash flow from operations loss of $8 million, down $7.9 million from the previous year.
- Amplitude introduced new features such as Amplitude Guides and Surveys to enhance user engagement, and platform enhancements in response to customer demand, including self-serve data deletion capabilities and Session Replay Everywhere.
- The company's co-founder and CEO, Spenser Skates, highlighted that Amplitude is seeing more enterprise customers embracing their platform, stronger multiproduct attach rates, and rapid innovation, with expectations of continued revenue growth in the upcoming quarters.
Read Full Article
20 Likes
Siliconangle
394

Image Credit: Siliconangle
Neo4j goes serverless, bringing graph analytics to any data source
- Neo4j Inc. has launched a new serverless offering to simplify the deployment of its graph database for use with AI applications.
- This serverless offering enables graph analytics to work with any data source without the need for complex ETL operations.
- Graph databases like Neo4j differ from traditional SQL platforms by using a graph structure of nodes, edges, and properties for data storage.
- They enable 'vector search' for unstructured data, making them ideal for AI applications to derive richer insights and patterns.
- Graph analytics can improve AI decision-making by uncovering hidden patterns and relationships in complex data.
- The new serverless offering, Neo4J Aura Graph Analytics, aims to make graph analytics accessible to all companies by removing adoption barriers.
- This service comes with over 65 graph algorithms, pay-as-you-go pricing, and optimized performance for AI applications.
- By using graph analytics, AI models can derive insights faster and adapt in real time to changing data, reducing coding tasks significantly.
- Neo4j's serverless platform promises to boost the accessibility of graph analytics for enterprises across different data sources and cloud platforms.
- The new offering eliminates the need for complex queries, ETL, and costly infrastructure setup, allowing organizations to tap into graph analytics' power.
Read Full Article
23 Likes
Pymnts
184

Image Credit: Pymnts
Etsy’s ‘Algotorial Curation’ Blends Human Touch With AI Smarts
- Etsy is implementing 'algotorial curation,' a strategy that combines human expertise with advanced AI algorithms to recommend products to shoppers.
- Human experts identify trends and select listings, which are then expanded using machine learning to create collections of about 1,000 items.
- Etsy uses Google's Gemini multimodal model for these experiences, leveraging AI to enhance human insight at scale without eliminating human involvement.
- The implementation of AI has led to improved search functionalities, increased visibility, and sales on Etsy, providing a more personalized shopping experience for consumers.
Read Full Article
11 Likes
Cloudblog
76

Image Credit: Cloudblog
How Looker’s semantic layer enables trusted AI for business intelligence
- In the AI era, accurate and consistent data insights are crucial, leading to the importance of a semantic layer for trusted definitions in organizations.
- Looker's semantic layer serves as a single source of truth for business metrics and dimensions, ensuring consistency in data interpretation for AI initiatives.
- A semantic layer aids in reducing errors and inaccuracies in AI applications, particularly gen AI, providing accurate business logic interpretation.
- Looker's semantic layer significantly reduces data errors in gen AI natural language queries, offering a reliable foundation for analytics and BI.
- Trusted gen AI relies on a robust semantic layer for accurate responses grounded in governed data, backed by deep business context and governance.
- Looker's LookML enables the creation of a semantic model that simplifies data structure and logic, ensuring consistent and accurate insights for users.
- The semantic layer ensures organizational alignment by standardizing definitions and terms, leading to consistent data interpretation and insights across the organization.
- Looker's LookML centralizes definitions, offers deterministic calculations, software engineering best practices, time-based analysis, and deeper data drills for comprehensive data understanding.
- By bridging the gap between data sources and business language, LookML allows for more intuitive and accurate data analysis, benefiting decision-makers.
- Looker's semantic layer enhances AI integration in BI by providing a structured data library, enabling AI agents to find relevant information for accurate responses.
Read Full Article
4 Likes
Cloudblog
287

Image Credit: Cloudblog
Build, use and share data with data products in BigQuery
- Google Cloud Next announced the experimental launch of data products in BigQuery to address challenges such as siloed data, lack of business context, and data reliability concerns.
- Data products in BigQuery allow for organizing, sharing, and leveraging data as a product, simplifying the transaction between data producers and consumers.
- Benefits of utilizing data products in BigQuery include reduced redundancy, better prioritization, demonstrable ROI, and built-in data governance.
- Data consumers can access faster insights and increased trust by easily searching, browsing, and discovering data products within the BigQuery environment.
Read Full Article
17 Likes
Pymnts
358

Image Credit: Pymnts
The Other Reason That Businesses Need to Know Their Customer
- Understanding a customer’s business inspires proactive solutions and builds trust over time.
- Delivering value to customers entails deep understanding of their needs, challenges, and goals.
- Being proactive means offering solutions before problems arise and adapting to evolving customer needs.
- Using data analytics is crucial to drive proactive conversations, measure impact, and foster long-term partnerships.
Read Full Article
21 Likes
Medium
278

Image Credit: Medium
Visualizing Team Collaboration Across Milestones in a Remote, Multidisciplinary Project
- The data visualization showcases an advanced method for monitoring collaboration intensity across various deliverable classes and project milestones.
- It is structured as a circular heatmap, with the radial dimension representing deliverable classes and the angular dimension corresponding to milestone sequences.
- Darker shades in the heatmap denote higher collaboration intensity, aiding in the quick identification of areas with concentrated team effort.
- The visualization, implemented using D3.js, offers dynamic interactivity, a slider control for timeline navigation, and an animation feature for a temporal narrative of collaborative evolution.
Read Full Article
16 Likes
Medium
59
Image Credit: Medium
Master Advanced Statistics for Data Science and Research — Your Next Big Career Move
- The course 'Master Advanced Statistics for Data Science and Research' offers in-depth statistical knowledge for students, researchers, and aspiring data scientists.
- It includes 10 comprehensive modules covering topics like regression, probability, Bayesian inference, machine learning, and experimental design.
- The course provides real-world case studies in areas such as healthcare, marketing, and AI to enhance practical learning.
- Offered in PDF format at $69 USD on Gumroad, the course aims to bridge the gap between theoretical knowledge and practical application in data science and research fields.
Read Full Article
3 Likes
Cloudblog
220

Image Credit: Cloudblog
Pushing the limits of electric mobility: Formula E's Mountain Recharge
- Formula E and Google collaborated on the Mountain Recharge project to test regenerative braking capabilities of EVs.
- Using AI and real-time monitoring, Formula E attempted to descend a high mountain pass to recharge and complete a lap at Monaco.
- AI Studio and Gemini 2.5 Pro were utilized to analyze the feasibility and plan the route for the Mountain Recharge challenge.
- Real-time telemetry and data visualization were facilitated by Firebase and BigQuery during the mountain descent.
- AI played a significant role in aiding coordination, planning, and developing technical solutions for the project.
- The success of the Mountain Recharge highlights the potential benefits of AI in industries for enhanced planning, project management, and data-driven decision-making.
- The campaign demonstrates the power of combining human ingenuity with intelligent technology to push boundaries.
- Formula E and Google Cloud showcase a commitment to using AI to innovate in sports and beyond, inspiring everyday drivers with EV capabilities.
- The project emphasizes the importance of asking the right questions and thinking big to achieve remarkable outcomes.
- AI's role in Formula E's Mountain Recharge campaign extends beyond a mere stunt, showcasing its potential in various industries.
Read Full Article
13 Likes
UX Design
310

Image Credit: UX Design
Generative AI and the triad color harmony
- Generative AI (Gen AI) systems faced challenges in suggesting a triad color harmony that passes color deficiency tests.
- While ChatGPT, Copilot, and Gemini chatbots failed in this aspect, DeepSeek provided a successful solution.
- Color harmony involves choosing colors on a color wheel that complement each other, based on Isaac Newton's color wheel concept from the 1700s.
- This article explores the importance of triad color harmony, color deficiencies, and the performance of text-based Gen AI systems in suggesting color schemes.
Read Full Article
18 Likes
For uninterrupted reading, download the app