A naukri.com initiative
Data Analytics News
Medium
263

Image Credit: Medium
Deep dive into Science of Data
- Data science involves the art of extracting insights from data to understand the past, evaluate the present, and predict the future through expertise in data science, machine learning, statistics, and mathematics.
- Key components of data science include statistics for understanding trends, computer science for managing data, machine learning for teaching computers, domain expertise for contextual understanding, and communication for presenting findings effectively.
- Data science is an interdisciplinary field that revolutionizes various industries worldwide by using data to solve complex problems and make informed decisions, offering lucrative career opportunities with roles like Data Scientist, Machine Learning Engineer, and AI Engineer.
- Choosing data science means entering a dynamic sector where one can leverage the potential of data to uncover insights, predict outcomes, and drive strategic decisions across sectors like technology, healthcare, and finance, offering a fulfilling and future-proof career path.
Read Full Article
15 Likes
TechBullion
414
Image Credit: TechBullion
How Real-Time Incident Reporting Improves Organisational Resilience
- Incident reporting is evolving from a compliance task to a real-time tool for organisations to enhance resilience.
- Real-time reporting allows businesses to identify patterns early, act swiftly, and share information efficiently across teams, contributing to agility and efficiency.
- Organisational resilience is crucial in today's unpredictable world, where the ability to detect, respond to, and learn from incidents in real time is essential for mitigating risks.
- Real-time reporting provides leading indicators that help in preventing incidents rather than reacting to them after they occur, supporting a proactive approach to safety and risk management.
Read Full Article
24 Likes
Pymnts
0

Image Credit: Pymnts
Tariff Turbulence Drives Operational Overhaul of US Mid-Sized Firms
- Mid-sized firms in the US, with annual revenues between $1 billion to $5 billion, are facing challenges due to tariff pressures and supply chain volatility.
- Over 90% of these mid-sized firms expect material shortages or shipping delays as a result of tariff impacts, leading to operational strategies overhaul across various aspects such as sourcing, production, design, and logistics.
- To mitigate the effects of tariffs, companies are implementing dual-sourcing strategies, accelerating digital transformation, rethinking product design, and investing in advanced technologies like artificial intelligence-driven demand forecasting.
- The current reset in operational strategies driven by tariff uncertainties is making mid-sized firms more adaptive, leaner, and better prepared for future trade disruptions and risks.
Read Full Article
Like
HRM Asia
69

Beyond automation: Thailand HR Tech explores the human side of HR transformation
- Thailand HR Tech Conference & Exposition 2025, led by PMAT, focuses on human-centered HR transformation amidst technological advancements.
- The event emphasizes trust, empathy, and people-first values in the face of rapid AI-driven organizational changes.
- The conference aims to unite HR professionals, business leaders, and tech innovators to explore the intersection of technology and humanity.
- It offers a platform for reimagining workplaces with a focus on innovation, inclusion, and sustainability.
- Attendees can expect strategic insights and hands-on learning through 80+ sessions on AI, HR analytics, and workplace wellbeing.
- 200 exhibitors will showcase the latest HR technologies, including solutions for enhancing employee wellbeing and productivity.
- The event features workshops and labs for actionable takeaways at various stages of digital transformation.
- Thailand HR Tech 2025 promotes a community that fosters exchange of ideas and co-creation of new futures for work.
- The event spotlights AI tools, employee-centric platforms, and technologies supporting agile, inclusive, and sustainable workforces.
- It presents an opportunity to align HR practices with broader societal goals, emphasizing sustainability and equity.
Read Full Article
4 Likes
HRM Asia
281

Should HR pros fear layoffs? Three tech CEOs debate AI’s impact on jobs
- As industries face AI-driven layoffs, HR leaders must navigate the workforce automation while acknowledging the threat to their traditional roles.
- IBM's use of AI agents to replace HR professionals highlights the tension between managing workforce transformation and potential job disruption within HR departments.
- AI adoption at IBM has led to an increase in total employment as resources are redirected to other areas like programming and sales.
- Concerns about job displacement by automation are significant, with 12.6% of current US jobs at high risk, raising questions about potential layoffs in HR and beyond.
- The rise of AI agents in HR functions poses a challenge as they automate tasks like payroll, candidate interviews, onboarding, reshaping the employee lifecycle.
- Tech CEOs discussed AI's impact on the workforce, debating whether AI replaces people directly or spurs the development of new skills to address evolving needs.
- Views differed on the potential of AI to open up untapped workforce opportunities, with discussions on roles restructuring and the displacement versus skill replacement dilemma.
- Shifts from specialisation to generalisation in job roles highlight the need for HR to prepare employees for more versatile roles amid AI integration.
- Analysts predict a reduction in HR headcount in certain areas, paving the way for new roles like change consultants, organisational design specialists, and learning architects.
- HR's evolving role encompasses building trust in human-AI collaboration, providing training, and shaping cultural norms, emphasizing the need for cultural transformation.
- The transformation brought by AI extends beyond tech sectors, requiring HR to adapt and prepare employees for a more broad-based skill set.
Read Full Article
16 Likes
Pymnts
39

Image Credit: Pymnts
For Hardee’s Franchisee, AI Analytics Is on Menu to Transform Operations
- Hardee’s franchisee Boddie-Noell Enterprises is leveraging AI and data analytics to enhance operational efficiency and customer satisfaction.
- By using real-time analytics, the company now gains insights into food costs, menu demand, payroll, and revenue, allowing for swift decision-making tailored to each restaurant.
- AI is revolutionizing financial decision-making, with CFOs eager to invest in AI solutions for real-time expenditure visibility and operational efficiency through predictive analytics.
- The impact of AI at Boddie-Noell includes optimizing staffing, menu planning, and customer payment methods, leading to increased sales and efficiency.
- The company extended breakfast hours based on data insights, resulting in a double-digit sales increase, while also adapting payment methods to enhance speed and reliability.
- AI was instrumental in identifying late-night staffing inefficiencies and determining menu items to promote for delivery and in-store sales, based on customer preferences.
- Boddie-Noell empowered its business workers with analytical tools, enabling them to make informed decisions and evaluate restaurant performance independently.
- Through AI-driven forecasting tools, the franchisee significantly improved accuracy, with projections off by only 0.1% in the first quarter of implementation.
- The success of Boddie-Noell's digital transformation underscores the power of data-backed decisions in driving operational growth and success.
- AI continues to reshape the fast-food industry, with companies like Hardee’s embracing advanced analytics to stay competitive and meet evolving customer demands.
Read Full Article
2 Likes
Cloudblog
205

Image Credit: Cloudblog
Fast, approximate analytics at scale: Apache DataSketches available in BigQuery
- Apache DataSketches is an open-source library of sketches that efficiently summarize large datasets using specialized streaming algorithms in a memory and computationally efficient manner.
- DataSketches provide accurate estimates of distinct counts, quantiles, histograms, and other statistical measures with minimal memory and computational overhead.
- These sketches offer mathematically proven error bounds that can be adjusted by users to balance accuracy and memory consumption.
- In BigQuery, DataSketches functions enable rapid approximate queries, saving on resources, and facilitating seamless interoperability across different systems and programming languages.
- DataSketches in BigQuery are implemented using custom C++ implementations compiled to WebAssembly (WASM) libraries, enabling efficient data analysis at scale.
- Apache DataSketches are used at Yahoo for various analytic query operations and have been adapted to leverage the large scale of BigQuery using JavaScript User Defined Aggregate Functions (UDAF).
- Different types of sketches available in BigQuery include Cardinality sketches like Hyper Log Log Sketch and Quantile sketches including KLL Sketch and REQ Sketch.
- DataSketches enable efficient estimation of user engagement metrics through Tuple Sketch, making them a powerful tool for analyzing large-scale datasets with unique identifiers.
- Using DataSketches in BigQuery allows for faster and more accurate estimations, providing valuable insights from massive datasets in a quick and resource-efficient manner.
- To start leveraging DataSketches in BigQuery, users can refer to the DataSketches-BigQuery repository README for building, installing, and testing the library for approximate analytics.
Read Full Article
12 Likes
Medium
157
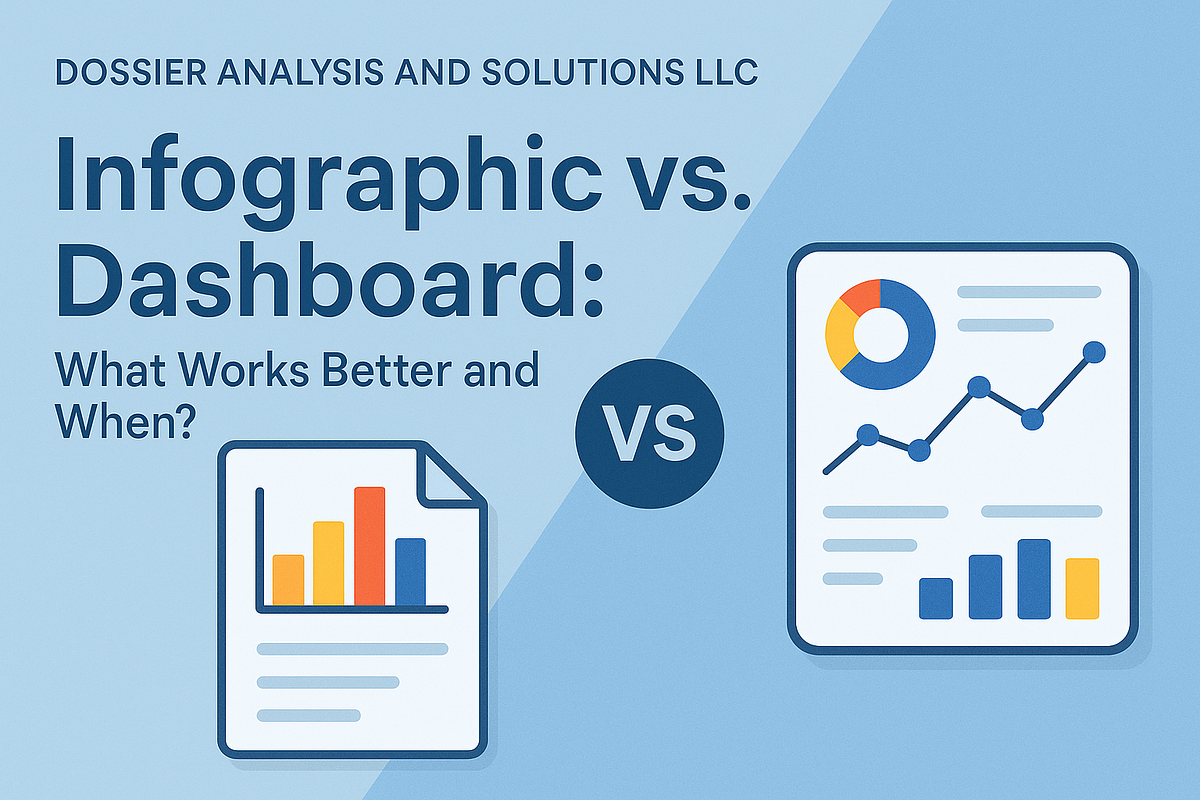
Image Credit: Medium
Infographic vs. Dashboard: What Works Better and When?
- Infographics and dashboards serve different purposes - infographics for one-time communication and dashboards for ongoing interaction.
- Infographics are static, elegant, and consumable at a glance, while dashboards are dynamic, interactive, and used for real-time decision-making.
- Knowing when to use each tool and designing them effectively, especially in tools like Power BI, is crucial for conveying messages and insights effectively.
- This article discusses when to choose an infographic vs. a dashboard, how to incorporate them into business intelligence workflows, and the benefits of combining both for maximum impact.
Read Full Article
9 Likes
Siliconangle
159

Image Credit: Siliconangle
Big-data visualization company Domo smashes Wall Street’s targets and its stock soars
- Domo Inc., a business intelligence and data visualization software firm, surpassed Wall Street's expectations with a strong earnings and revenue beat in late trading.
- The company reported a first-quarter loss of nine cents per share, exceeding the consensus estimate of a 19-cents-per-share loss, with revenue meeting expectations at $80.1 million.
- Domo has transitioned to a consumption-based pricing model, impacting its sales productivity positively by over 60% and posting adjusted operating income of $1.03 million, beating analyst estimates.
- The company provided a robust profit forecast for the current quarter, expecting earnings between three and seven cents per share, and slightly raised its full-year revenue guidance for fiscal 2026 while lowering its earnings target.
Read Full Article
9 Likes
Medium
363

Image Credit: Medium
How Amazon Uses A/B Testing to Optimize Pricing Without Losing Customer Trust
- Amazon uses A/B testing to optimize pricing to maximize conversion rate, order value, and profit margins while ensuring customer trust.
- To mitigate risks like customer distrust, legal compliance, vendor relationships, and cannibalization, Amazon focuses on transparent and fair discounts, following regional pricing laws, strategic vendor communication, and analyzing total margin impact.
Read Full Article
21 Likes
Cloudblog
323

Image Credit: Cloudblog
Introducing AI.GENERATE_TABLE: creating structured data from gen AI models in BigQuery
- BigQuery, connected with Vertex AI, integrates advanced AI models like Gemini 2.5 Pro/Flash to analyze unstructured data.
- Google's AI models can extract key information from various data formats and generate structured insights.
- AI.GENERATE_TABLE() in BigQuery converts unstructured data insights into structured tables based on prompts and schema.
- To analyze images, create a table for image data and connect to the Gemini 2.5 Flash model in BigQuery.
- Using AI.GENERATE_TABLE() with images, specify prompts for city recognition and output structured data format.
- The model identifies cities in images, providing names, states, history, and attractions, showcasing its capabilities.
- AI.GENERATE_TABLE() can also extract structured data from medical transcriptions with specified schema.
- For medical transcriptions, the model accurately extracts information like age, blood pressure, conditions, diagnosis, and medications.
- AI.GENERATE_TABLE() facilitates easy data transformation in BigQuery for efficient analysis and integration.
- For more details and feedback on these features, refer to the documentation or contact [email protected].
Read Full Article
19 Likes
Medium
162

Image Credit: Medium
Why Your Prices Are Broken (and AI Knows It)
- Retailers relying on outdated static pricing are falling behind in today's competitive market where AI-driven dynamic pricing is becoming the norm.
- AI utilizes real-time data to adjust prices based on demand, weather, traffic, stock levels, and customer behavior for thousands of products continuously, unlike traditional pricing strategies.
- Dynamic pricing is seen as more fair as it personalizes value depending on customer browsing location, intent, and demand, presenting a smarter alignment between prices and real-time market conditions.
- AI-driven dynamic pricing is not just a future concept but a strategic lever that mid-size retailers and eCommerce brands are already using to stay competitive and drive significant results.
Read Full Article
9 Likes
Medium
8

Image Credit: Medium
AI Agents with Deephaven
- MCP (Model Context Protocol) acts as the USB of AI agents, simplifying the process of creating tools and connecting them without needing unique integrations for each model.
- Deephaven integration with Claude demonstrates how MCP streamlines the process, enabling easy access to worker and table information, insightful answers to queries, and code execution.
- The demo showcases two MCP servers, with the first allowing Claude to interact with Deephaven workers for various tasks, and the second providing access to Deephaven's documentation for knowledge repository functions.
- MCP's true value lies in its versatility to work with different AI agents, and while Claude desktop was used for the demo, any compatible agent can be utilized.
Read Full Article
Like
Associationsnow
377

Image Credit: Associationsnow
Stop Guessing, Start Growing: Keys to Unlocking Your Data
- Data plays a crucial role in understanding an association's members, events, and engagement, leading to informed decisions and improved strategies.
- Member data offers insights into preferences, aiding in targeted engagement and retention strategies based on past interactions and preferences.
- AI can track engagement trends, helping prevent member disengagement by sending personalized messages and content tailored to individual interests.
- Financial data is essential for monitoring revenue, optimizing costs, and forecasting financial health through tools like Microsoft Copilot and scenario planning.
- Financial ratios and benchmarking against industry standards help in assessing an association's stability and competitiveness.
- Event data is vital for measuring success, analyzing attendee interest, and improving future events based on factors like session attendance and engagement.
- Analyzing event data can help in tailoring future events to align with member interests and organizational goals, ultimately enhancing member satisfaction and event profitability.
- By leveraging member, financial, and event data, associations can make data-driven decisions to optimize retention strategies, enhance member experiences, and achieve long-term success.
Read Full Article
22 Likes
Medium
201

Prototype Super Fast and Furious
- Building prototypes is not just about speed but also about de-risking ideas by testing assumptions.
- Prototypes are meant to address the riskiest assumptions, not focusing on creating a mini version of the final product.
- It is recommended to build something fast, even if it's ugly, to stress-test beliefs and measure actual user behavior.
- Failed prototypes are valuable resources for learning, and the goal should be to interrogate assumptions and expose flaws early on.
Read Full Article
12 Likes
For uninterrupted reading, download the app