A naukri.com initiative
Data Analytics News
Medium
256

Image Credit: Medium
How an Economics Degree Can Land You a Job in Data Analytics
- Economics degree equips individuals to think in patterns, spot trends, and work with data, skills crucial for data analytics jobs.
- Many economics graduates are unaware that they possess skills relevant to data analytics careers.
- The intersection of economics, technology, and data presents new opportunities for individuals with an economics background in data analytics.
- Having a degree in economics means having experience with data, laying a strong foundation for transitioning into data analytics.
Read Full Article
15 Likes
Siliconangle
185

Image Credit: Siliconangle
Semantic data layer startup Cube automates analytics with AI agents
- Cube Dev Inc. is introducing an agentic analytics platform that automates data analytics tasks using artificial intelligence.
- The platform includes AI data co-workers that enhance analytics tasks, support natural language queries, explain insights, and offer comprehensive governance.
- Cube's semantic layer simplifies data access from various systems and addresses challenges of accessing and formatting data from multiple databases.
- Developers can perform real-time calculations on different datasets using Cube's platform and benefit from lower computing costs due to in-memory cache.
- Cube is incorporating AI agents like AI Data Analyst and AI Data Engineer to automate data analytics tasks and enhance the semantic layer.
- The AI agents are designed to provide self-serve analytics, automate semantic models development, and facilitate quicker changes in the semantic layer.
- Cube aims to release more AI agents, including a data science agent for anomaly detection and predictions, later this year.
- The AI data agents by Cube operate autonomously within enterprise data frameworks, ensuring governance controls, trust, transparency, and explainable outputs.
- Cube's AI agents aim to increase the velocity of analysis tasks and reduce the time required for making changes in the semantic layer.
- The combination of Cube's semantic layer and AI agents aims to empower users to explore data independently and efficiently.
Read Full Article
11 Likes
Medium
332

Image Credit: Medium
Beyond Segmentation: How AI-Driven Hyper-Personalization (Fueled by Analytics) is Redefining…
- Artificial Intelligence (AI) plays a crucial role in hyper-personalization, processing vast datasets to understand individual preferences and predict intent accurately.
- AI aids in content generation, variation, orchestration, and delivery of personalized experiences, leading to significant revenue generation for companies excelling in personalization.
- Analytics complements AI in executing hyper-personalization effectively by providing continuous feedback loops for intelligent and adaptive personalization strategies.
- Product Managers can leverage AI for scale, analytics for insights, and a strategic fusion of the two to move towards true 1:1 hyper-personalization, driving customer engagement and business growth.
Read Full Article
19 Likes
Medium
144
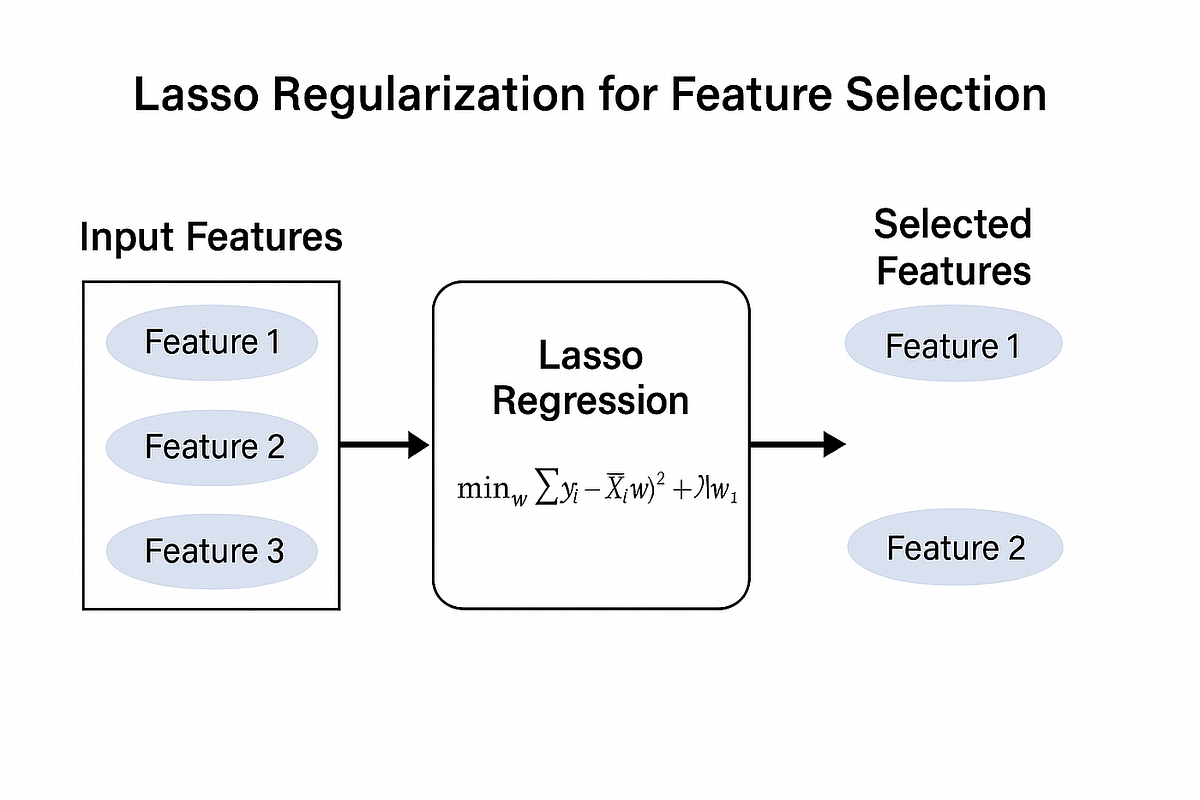
Image Credit: Medium
Understanding the Magic of LASSO Feature Selection
- LASSO is a technique that combines linear regression with L1 regularization to automatically select relevant features and produce sparse models.
- The optimization function of LASSO minimizes the sum of squared residuals while constraining the sum of absolute weights, forcing many coefficients to zero.
- L1 regularization in LASSO creates a constraint region in parameter space, essential for feature selection by forcing some coefficients to exactly zero.
- LASSO is useful for feature importance analysis, robust to multicollinearity, and can be visualized through the regularization path of coefficients.
Read Full Article
8 Likes
Cloudblog
300
Image Credit: Cloudblog
Announcing new capabilities for boosted productivity in Colab Enterprise
- Colab Enterprise introduces new productivity-boosting features, including code assistance powered by Gemini, a Notebook gallery, and a UX redesign.
- Gemini integration allows for code completion, code generation, error explanations, and error fixes, enhancing development efficiency.
- The Notebook gallery provides access to sample notebooks for various categories, tags, search functionality, and detailed metadata.
- The UX refresh in Colab Enterprise includes a new dashboard, expanded editor, dark mode, and integrations with Vertex AI services for improved developer productivity.
Read Full Article
16 Likes
Medium
76

Image Credit: Medium
Life Goal Achieved: Climbing to Space on My Own Two Legs
- A hiker discovered that he had officially hiked to space after updating his activity tracker spreadsheet, achieving his years-in-the-making dream.
- He floated through Low Earth Orbit without buying a seat on a rocket, marking a significant achievement in his hiking adventures.
- The hiker had summited St. Helens in 2016, Mount Adams in 2017, and various popular trails in the Pacific Northwest, contributing to his total accumulated vertical hike.
- Through a rigorous analysis of his hiking data, he calculated his capabilities and planned for future trips, showcasing his dedication to hiking and adventure.
Read Full Article
4 Likes
Siliconangle
209
Image Credit: Siliconangle
ClickHouse reels in $350M for its high-speed columnar database
- ClickHouse Inc. has secured $350 million in a Series C funding round led by Khosla Ventures, bringing its total funding to over $650 million.
- ClickHouse's database, based on a columnar architecture, optimizes data retrieval by storing columns adjacent to each other for faster query processing.
- The database includes performance optimizations like vectorized query execution, range query simplification, and the ability to handle massive scales of data.
- ClickHouse plans to use the new capital to accelerate product development and expand its global presence, serving over 2,000 customers including major tech firms like Sony Corp. and Anthropic PBC.
Read Full Article
12 Likes
Siliconangle
360
Image Credit: Siliconangle
Google Cloud rolls out new BigLake and BigQuery features to ease analytics projects
- Google Cloud introduced new features for its BigLake and BigQuery services to facilitate analytics projects.
- The updates center around Apache Iceberg, enhancing data organization, query efficiency, and SQL support.
- BigLake now allows easier data loading from external sources, improved integration with other Google Cloud services, and enhanced cybersecurity measures.
- BigQuery is getting a set of features under the BigQuery advanced runtime to speed up user queries, including data pruning and vectorization for faster operations.
Read Full Article
21 Likes
Cloudblog
425
Image Credit: Cloudblog
Google Cloud’s open lakehouse: Architected for AI, open data, and unrivaled performance
- Google Cloud's Data Cloud platform integrates AI with an open lakehouse architecture, offering organizational benefits.
- Snap Inc. praises Google Cloud's open lakehouse for empowering data engineers and scientists.
- Innovations include BigLake Iceberg native storage leveraging GCS, united operational and analytical engines, and performance enhancements for BigQuery SQL.
- The High-performance Lightning Engine for Apache Spark and Dataplex Universal Catalog provide further improvements.
- BigLake services aim to create open, unified, and interoperable storage runtimes for Google Data Cloud.
- BigLake metastore facilitates openness and interoperability across data ecosystems, simplifying management and governance.
- Analytical engines like BigQuery can now read and write Iceberg data, enhancing functionality and openness for users.
- The Lightning Engine for Apache Spark accelerates performance through optimized data connectors, improving Spark performance.
- Dataplex Universal Catalog provides AI-powered intelligence for effective data strategy and governance across Google Cloud.
- AI-native notebooks and tooling, including Gemini-powered capabilities, enhance developer experiences for improved productivity.
Read Full Article
25 Likes
TechBullion
69
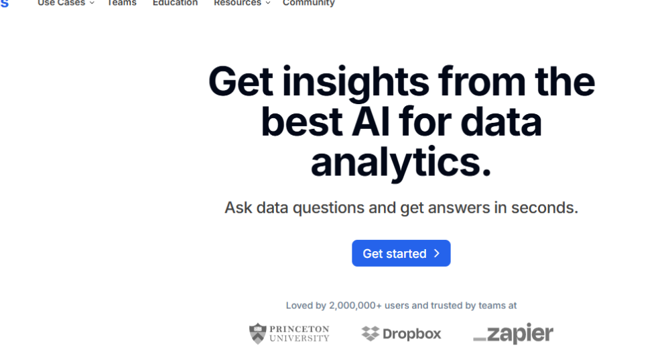
Image Credit: TechBullion
How to Use Data Analytics to Make Better Business Decisions
- Businesses are inundated with data but must leverage data analytics for informed decisions.
- Data analytics helps in spotting trends, identifying problems, and discovering opportunities.
- Analyzing customer interactions generates valuable data for guiding strategies.
- Data analytics reveals hidden patterns and allows for targeted strategies.
- Internal operations benefit from data analytics by identifying inefficiencies and reducing costs.
- Understanding customer preferences is crucial for improving business growth and personalized experiences.
- Long-term planning benefits from data analytics by forecasting trends and market conditions.
- Real-time data tracking enables agile decision-making and quicker responses to market changes.
- Building a data-driven culture is essential for fostering innovation and adaptability.
- Data analytics empowers businesses to grow confidently backed by solid evidence.
Read Full Article
4 Likes
UX Design
51
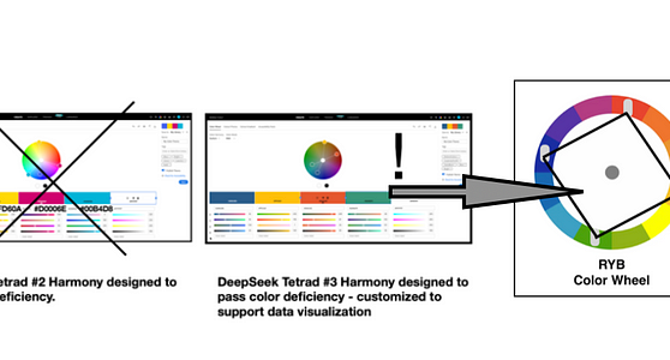
Image Credit: UX Design
GenAI dataviz: DeepSeeking a tetrad color suggestion that passes color requirements
- This article discusses how the Generative AI system, DeepSeek, suggests a tetrad color harmony that passes color deficiency tests.
- The author explored Generative AI and tetrad color harmony using various systems before evaluating DeepSeek's tetrad color suggestions.
- Color harmony involves choosing colors on a color wheel that work well together in an image composition, based on combinations that provide guidelines for color hues to work together.
- Isaac Newton created the color wheel concept in the 1700s, and artists and color scientists further developed it to include color harmonies.
Read Full Article
3 Likes
TechBullion
399

Image Credit: TechBullion
Integrating Cloud Computing in Manufacturing Operations Services Tailored for Manufacturers in the USA
- Cloud computing is becoming increasingly essential for manufacturers in the United States due to its ability to enhance operations and competitiveness.
- Cloud integration allows for seamless collaboration among team members, promoting innovation and accelerating time-to-market.
- Remote work benefits from cloud-based systems by enabling operations oversight and contribution from anywhere, ensuring workflow continuity.
- Cloud platforms offer real-time data analytics tools that optimize production, reduce downtime through predictive analytics, and enhance resource utilization.
- Cost reduction is a significant advantage of cloud computing, as it operates on scalable subscription models and minimizes infrastructure costs.
- Cloud computing enhances supply chain management by centralizing data, improving inventory tracking, and automating alerts for delays or shortages.
- Data security concerns are addressed by reputable cloud providers through advanced cybersecurity measures and compliance-ready solutions.
- Challenges in cloud integration include legacy system compatibility, skill gaps, and data sovereignty concerns, which can be mitigated through proper planning and training.
- Best practices for cloud adoption include assessing high-impact areas, choosing a suitable cloud model, selecting a reliable provider, ensuring interoperability with existing software, and prioritizing cybersecurity.
- Cloud computing is a transformative technology that offers efficiency, agility, and security benefits to U.S. manufacturers, shaping the future of the industry.
Read Full Article
24 Likes
Medium
383

What is Data?
- Data is traditionally defined as a value obtained from observations, measurements, or experiments, but in today's context, it includes a wide range of forms like pictures, videos, social media posts, and GPS coordinates.
- A more accurate and inclusive definition of data is: 'Any form of information whether numerical, textual, visual, audio, or symbolic that can be captured, stored, processed, and interpreted to derive meaning or support decision-making.'
- This definition encompasses both traditional and modern digital forms of data, reflecting the diverse and information-rich world we live in.
- In my work, I define data as information in various formats that can be processed and analyzed to provide insights or support decision-making.
Read Full Article
23 Likes
Siliconangle
181
Image Credit: Siliconangle
Heatseeker AI raises $1.5M in funding for its market research platform
- Heatseeker AI has raised $1.5 million in pre-seed funding to enhance its market research platform.
- The funding was led by Capital F with participation from Euphemia, Even Capital, and East End Ventures.
- Heatseeker's platform relies on online ads to gather user feedback for market research, offering a more reliable source than traditional surveys.
- The company plans to use the funding to launch a tool called Synthetic Experiments, leveraging AI to accelerate market research programs and reduce costs.
Read Full Article
10 Likes
Medium
150

Image Credit: Medium
The Myth of Overnight Success: What No One Tells You
- The concept of overnight success is a deceptive illusion, masking years of hard work and persistence behind every successful story.
- Social media often portrays only the highlights of success, neglecting the unseen failures and sacrifices that lead to achievements.
- True success is not built quickly but through prolonged effort, resilience, and determination, teaching valuable lessons that shortcuts cannot provide.
- Success should be redefined as finding inspiration, creating meaning, failing forward, making an impact, and being proud of personal growth, emphasizing the long-term journey over instant gratification.
Read Full Article
9 Likes
For uninterrupted reading, download the app